On this page

The Chart data scripts screen lists all available scripts, providing the following information:

PropertyFunction
NameThe name of the script
LayoutThe Javascript layout used by the script
AuthorThe creator of the script
CreatedThe timestamp of script creation
UpdatedThe timestamp of the last update
OperationsAvailable operations for each script:
  • Edit
  • Delete
  • Copy

Creating a chart data script

Editing a chart data script

On the Chart Data Scripts page, click on "edit" under the actions column to edit a saved configuration.

General

In the General section you can edit the Name and the Description of your template. Also you can preview the chart.

Layout
  1. Layout name: next to the layout name the dropdown will display all available Javascript layouts and selecting other than the current one, you can see the Javascript of the new selected layout.
  2. Inline Edit: possibility to edit the Javascript layout while writing the Groovy script. This makes testing much easier, combined with the chart preview functionality.
    • Javascript: the actual Javascript code that renders the chart.
    • Style: CSS style that can be used in the chart.
Parameters

In order to provide maximum flexibility and usability of charts, xCharts allows creation of parameters for a scripted chart.

Parameters are variables used in the scripted chart, which at chart render time provide certain Jira specific (user/group/project/date picker) fields or custom (chart type picker, text) fields.

Parameters must have unique names, so try not to use keywords, or variable names from the script. This might lead to errors when running the script!

There are multiple types of parameters, and we also plan on adding new types as we release new versions. For a complete reference on parameters, and the versions they were introduced in, see Script Parameters.

Available types include:

Parameter typeDescription
TEXTsimple text parameter, simply replace some labels, chart title, etc.
BOOLEANcheckbox which sets the value of a boolean (since version 1.2.0)


PICKER


Possibility to choose some Jira Inputs, like:

User Picker (single and multi-select)
Group Picker (single and multi-select)
JQL Autocomplete

Project/Issue Picker (single/multi select)

Date Picker

Interval Picker (since version 1.1.4)

Time Period Picker (since version 1.1.4)

Value Picker (single and multi-picker - since version 1.1.4)

Text Area

SQL Text Area

This makes charts very customizable, and a general template with multiple parameters can provide a lot of different statistics.

Groovy Script

The script section is where your actual chart logic written in Groovy goes.

There are two ways to achieve it:

  1. using a Groovy script from the JIRA_HOME directory SINCE VERSION 1.5.0
  2. writing the script in the the provided text area

Click Save in order to save or update the script. Click Cancel to get back to the Chart Data Scripts screen.

Using files from JIRA_HOME when scripting charts

In order to be able to use resources from the file system (Groovy scripts for charts, Javascript resources, CSS resources), one needs to create inside the JIRA_HOME directory a folder called xcharts, where all these files must be saved in order to be found by xCharts.

There is no Jira restart needed for this action. Once copied there, the resources will be available when scripting charts, like the following:

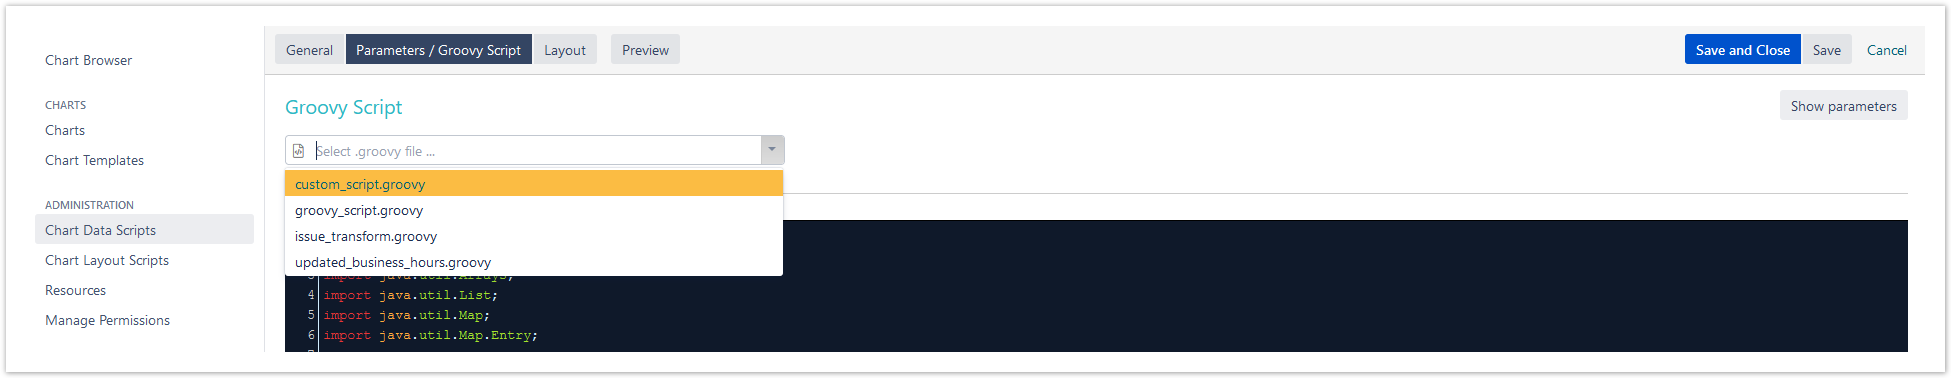
It is currently not possible to edit the files from JIRA_HOME directly in the UI, and therefore, when using such a file, the editor text area is deactivated.

Context variables

Context variables can be used in the Groovy Script without declaring them, because they are available at run-time, and they can be called by name. 

By default in xCharts, you have access to some context variables:

Context variableDescription
userthe logged in user

dateUtils

com.decadis.jira.xchart.api.util.DateUtils is for easier formatting of dates (see xCharts API Javadoc)
chartBildercom.decadis.jira.xchart.api.util.ChartBuilder is a helper class that provides easy access to the most important classes (see xCharts API Javadoc)

For example, instead of using: ApplicationUser user = ComponentAccessor.getJiraAuthenticationContext().getLoggedInUser();

you could use: user

Preview

You have the possibility to visualize modifications done to a scripted chart before saving.

For maximizing development efficiency changes in parameters are also reflected here.


If you still have questions, feel free to refer to our support team.