On this page
In order to ensure the greatest flexibility, xCharts includes functionality to create chart layouts that fit your needs regarding the general aspect of the chart, axis labeling, etc.
The Manage chart layouts screen lists all available chart layouts, providing the following information:
| Property | Function |
|---|---|
| Name | The name of the layout |
| Author | The creator of the layout |
| Scope | Which type of resource was used |
| Chart data scripts | List of all scripts that are using this resource |
| Created | The timestamp of layout creation |
| Updated | The timestamp of the last update |
| Operations | Available operations for each script:
|
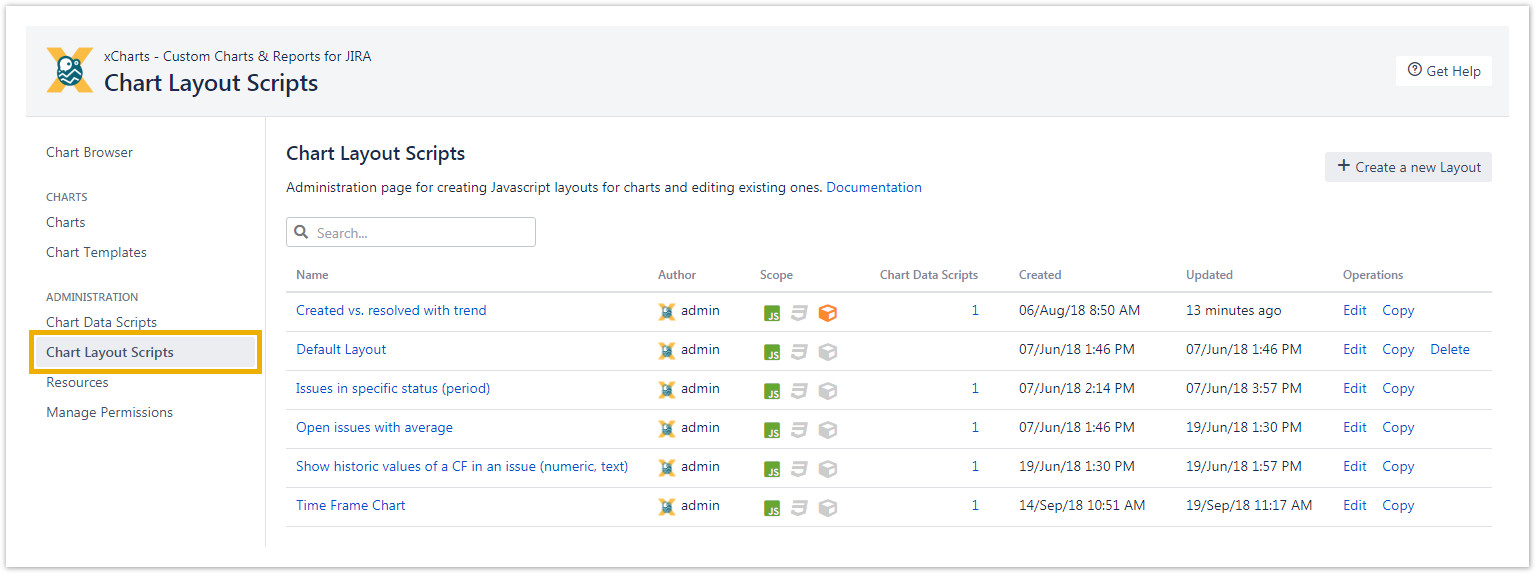
In order to get to the Edit layout screen, click on the Create a new layout button or Edit an existing layout.
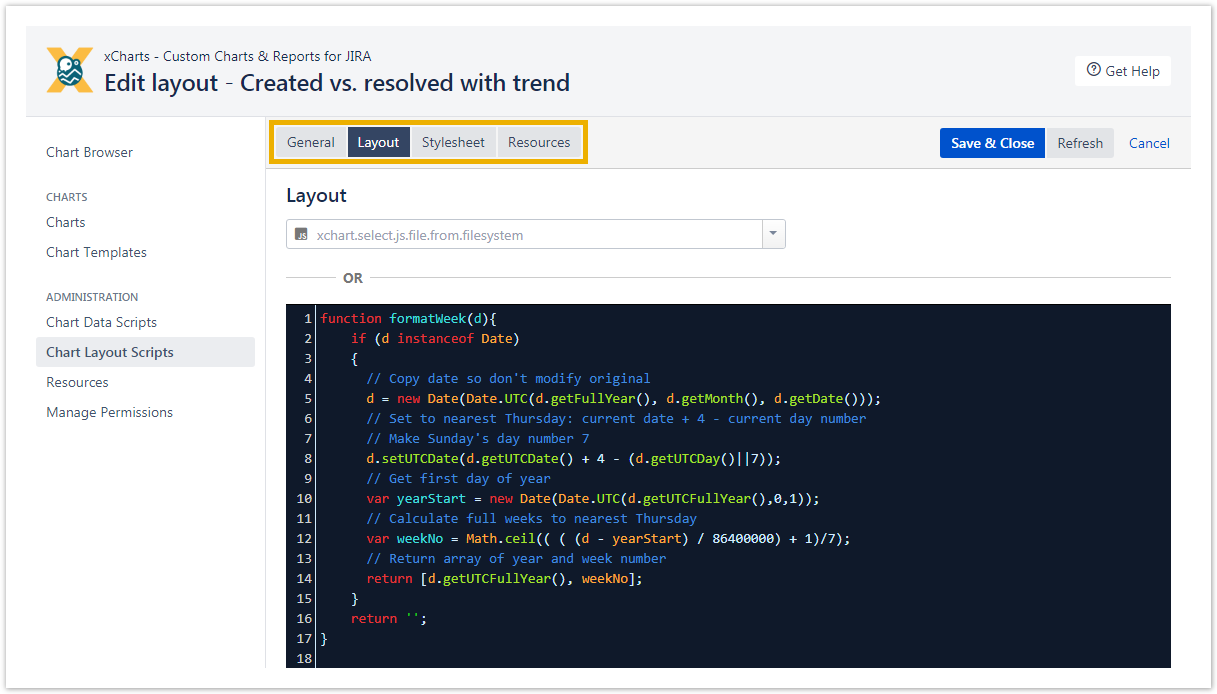
 Editing a chart layout script
SINCE VERSION 1.5.0, it is possible to navigate between the single sections via tabs. Furthermore, it is possible to load scripts (*.js and *.css files) from the JIRA_HOME directory.
In order to select your scripts in the drop-down, those files have to be placed within the folder xcharts in your JIRA_HOME → JIRA_HOME/xcharts/
You will need to manually create this folder once in your instance, granting permissions to the user running your Jira application.
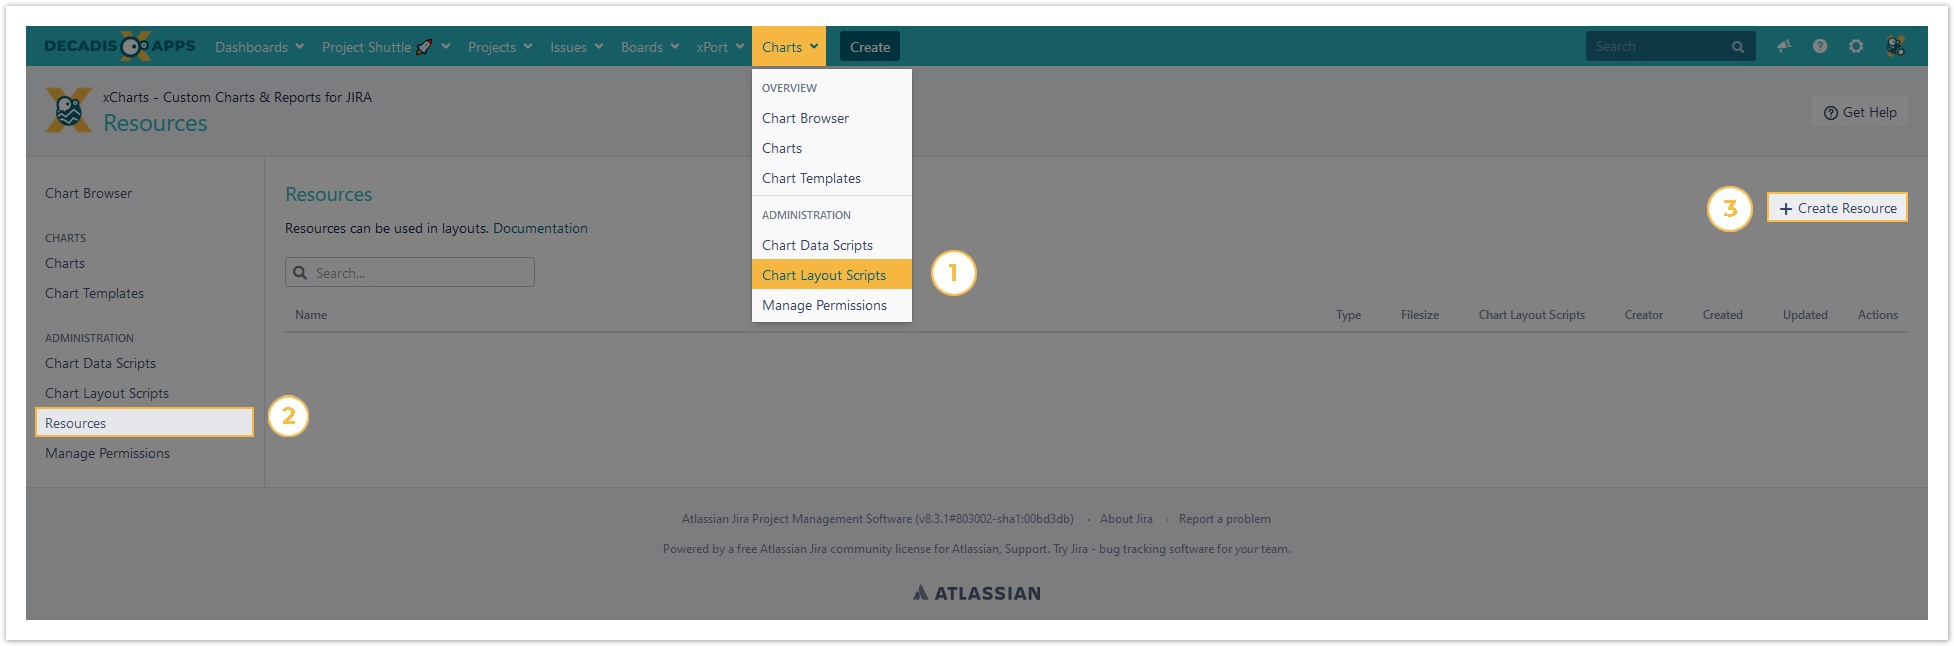
Resources are Javascript and CSS files that can be used in layouts. The most common scenario for such a resource would be some corporate CSS that should be included in multiple charts or an external Javascript library.
Creating resources is pretty straightforward, by navigating to the Resources page and then clicking the Create resource button.
After creating a resource, it is possible to choose this resource in the Javascript layout, by checking the corresponding resource checkbox.
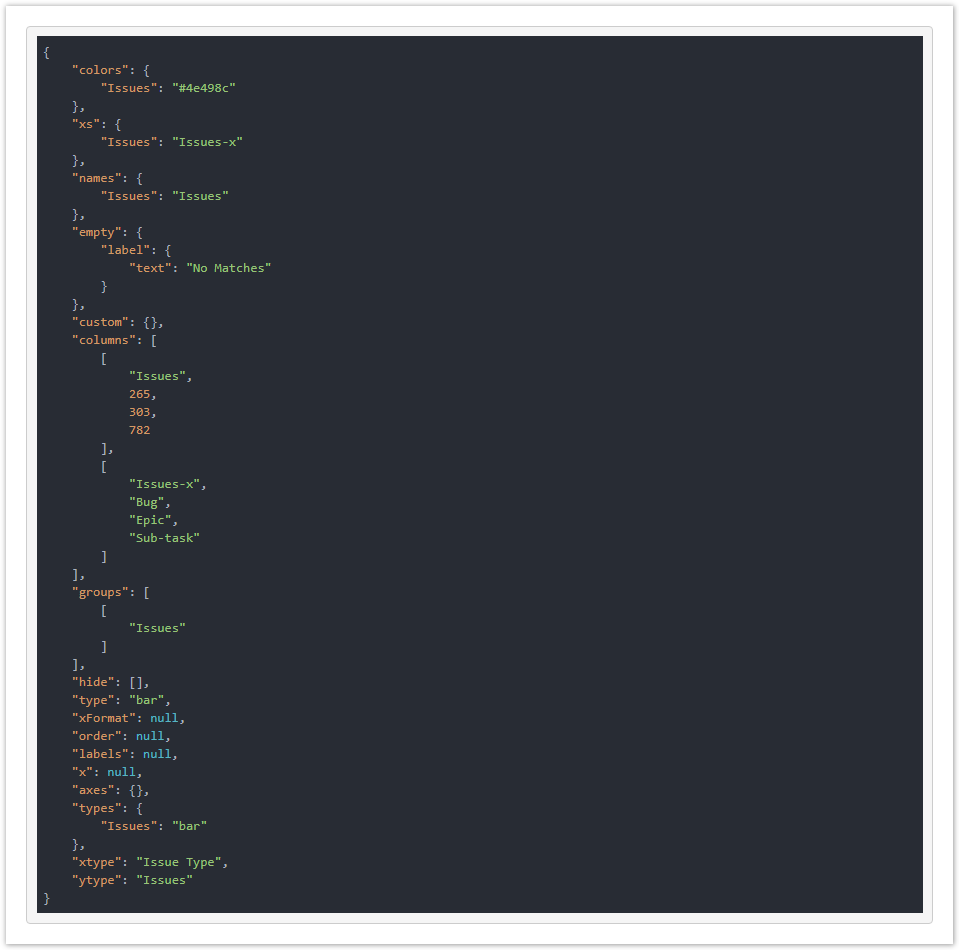
SINCE VERSION 1.5.0, it is possible to display the chart data in Json format under the scripted chart.
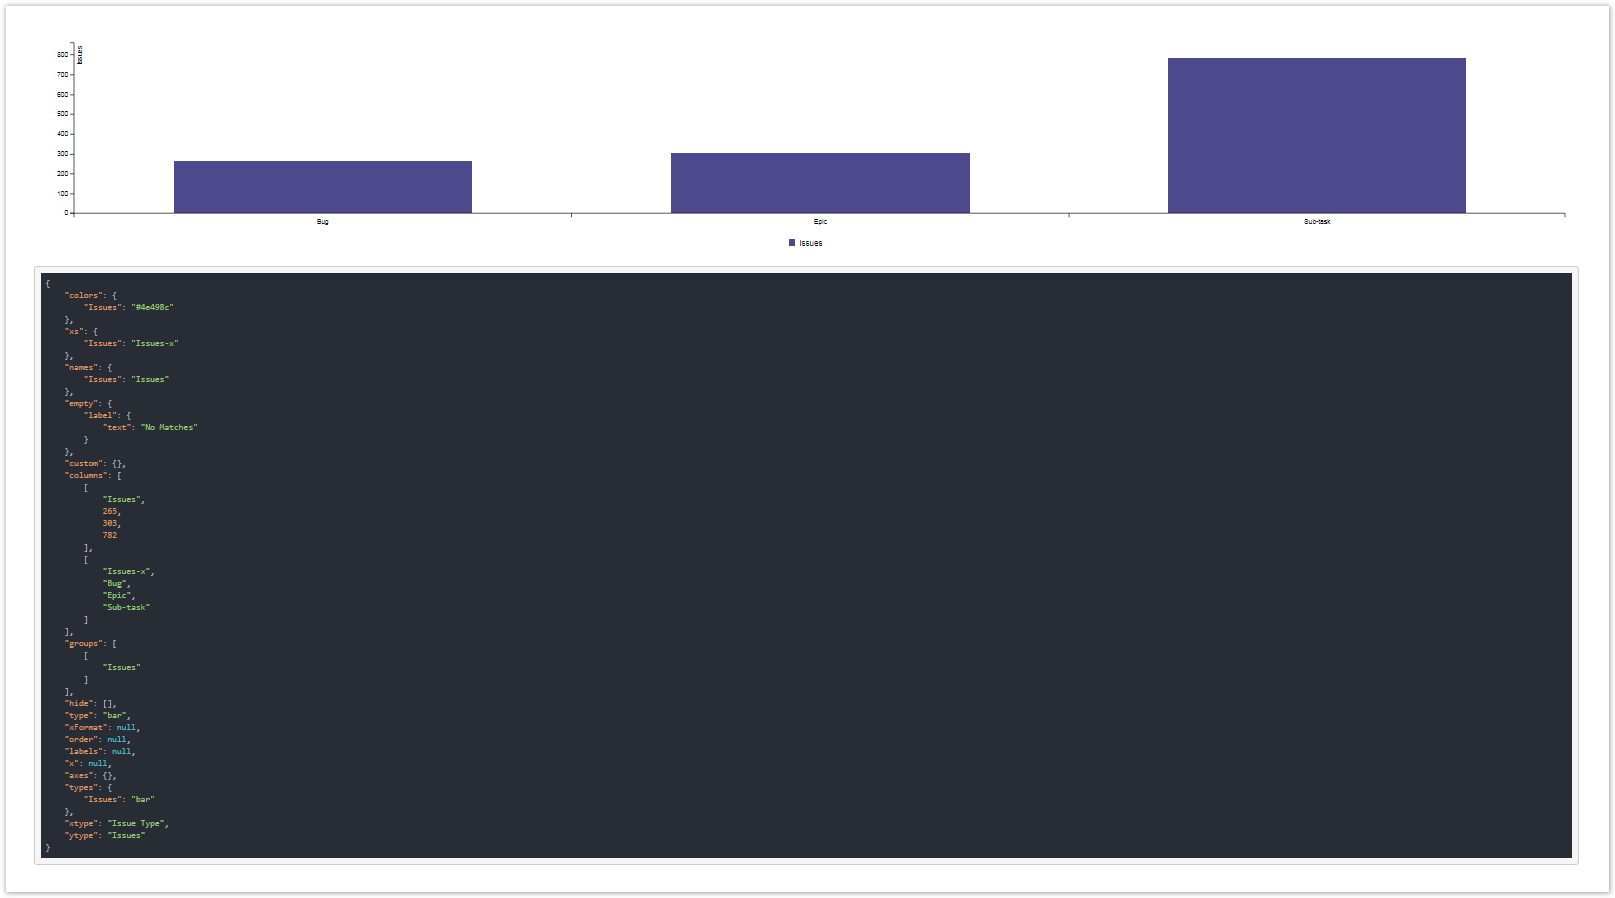
By typing the following:
highlightChartDataJson.init(chartData);
in the JavaScript layout script, the chart data will be displayed.
This method is only for developing purposes. This code snippet has to be removed from the layout script when using the chart. Otherwise, the chart data will always be displayed - also in xCharts Gadgets.
This method will simplify the usage and the workflow within charts.
If you still have questions, feel free to refer to our support team.