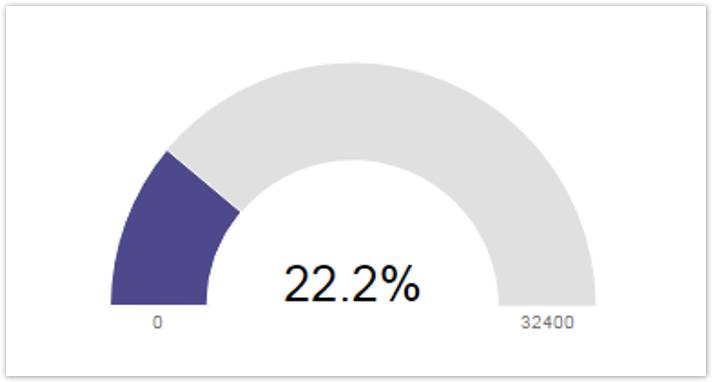
The progress by project shows the overall progress of a specific project. Estimated time vs. logged time.
Chart preview
Parameters
| Parameter | Type | |
|---|---|---|
| in UI | in Code | |
Project | ProjectParam | Project Picker (single project) |
Layout Script
Used layout: Gauge.
//helper function
function formatTooltipAsHours(value)
{
    return value.toFixed(2) + ' h';
}


var columns = [];
if (chartData.columns && chartData.columns.length){
    columns.push(chartData.columns[0]);
}

//generate the basic properties for generating the chart
var c3arg = {
    onrendered: updateFrameHeight,
    data: {
        columns: columns,
        type: chartData.type,
        colors: chartData.colors,
        empty: chartData.empty
    }
};

// on hover over the gauge, display the time in hours
if (chartData.custom && chartData.custom.tooltip)
{
    var tooltipFunction = eval(chartData.custom.tooltip);
    c3arg.tooltip = {
        format: {
            value: tooltipFunction
        }
    };
}

//set the maximum value on the gounge, in our case, total number of hours
if ( chartData.custom && chartData.custom.gauge_max)
{
    c3arg.gauge = {
        max: parseFloat(chartData.custom.gauge_max)
    };
}

c3.generate(c3arg);
Data Script
import java.text.DateFormat;
import java.util.Calendar;
import java.util.List;

import com.atlassian.jira.component.ComponentAccessor;
import com.atlassian.jira.issue.Issue;
import com.atlassian.jira.jql.builder.JqlClauseBuilder;
import com.atlassian.jira.jql.builder.JqlQueryBuilder;
import com.atlassian.jira.util.I18nHelper;

import com.decadis.jira.xchart.api.ChartParam;
import com.decadis.jira.xchart.api.util.DateUtils;
import com.decadis.jira.xchart.api.model.Period;


//transform seconds in hours, for a nicer display on the chart
def TimeInHours = { BigDecimal bd -> BigDecimal.valueOf(bd.longValue() / 3600.0d);}

def dateFormat = DateUtils.GetDateformat("yyyy.MM.dd");
def i18n = ComponentAccessor.getJiraAuthenticationContext().getI18nHelper();

JqlClauseBuilder jqlClauseBuilder = JqlQueryBuilder.newClauseBuilder();

// ProjectParam - is a Parameter of type Project Picker (single project)
if ( ProjectParam != null ) {
  jqlClauseBuilder.project(ProjectParam);
}

List<Issue> issues = chartBuilder.getFilterUtils().performSearch(jqlClauseBuilder.buildQuery(), user);
def metaCountGroup = chartBuilder.newDataCollector();

Long total = 0l;

for ( Issue issue : issues )
{
  Calendar cwCreated = chartBuilder.getDateUtils().getStartOfPeriod(issue.getCreated(), Period.MONTH);
  String cw = dateFormat.format(cwCreated.getTime());
  Object oe = issue.getOriginalEstimate();
  if ( oe != null )
  {
    Long remaining = issue.getEstimate();
    total += (remaining != null ? remaining : 0);
    Long spent = issue.getTimeSpent();
    if ( spent != null )
    {
      total += spent;
      metaCountGroup.addValue(TimeInHours(spent), i18n.getText("common.concepts.time.spent"), cw);
    }
  }
}

def chartData = chartBuilder.newChartData(i18n.getText("common.concepts.progress.bar"));
chartData.addCustomData("gauge_max", String.format("%.2f", total / 3600.0));
chartData.setxFormat("%Y.%m.%d");
chartData.setPeriod(Period.MONTH);
chartData.setType("gauge");
chartData.addCustomData("tooltip", "formatTooltipAsHours");

chartBuilder.getChartUtil().transformResult(metaCountGroup, chartData, true);

return chartData;
If you still have questions, feel free to refer to our support team.