The versions release dates chart shows release dates for versions in the selected projects over time.
Chart preview
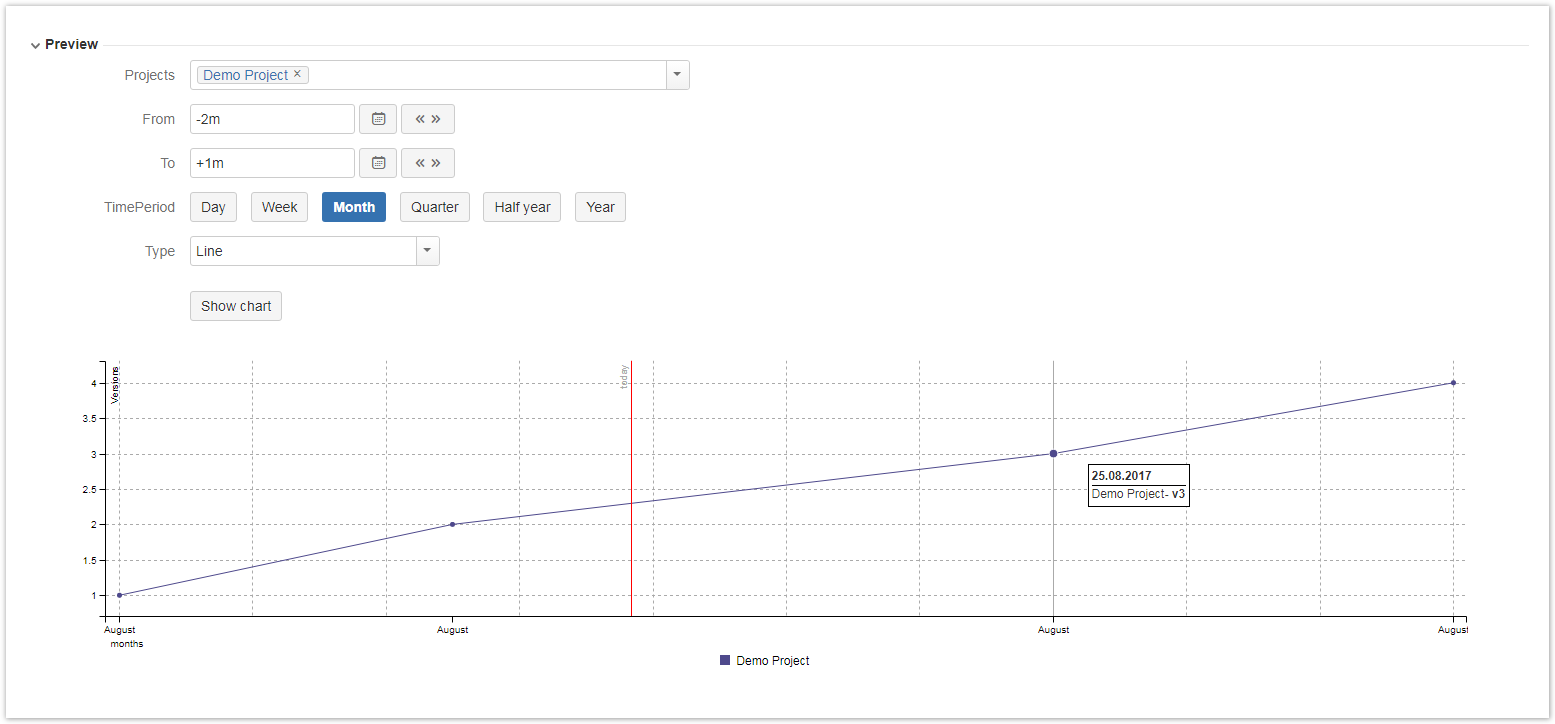
Parameters
| Parameter | Type | Default value | |
|---|---|---|---|
| UI | Code | ||
| Projects | Projects | Projekt Picker (multiple projects) | |
| From | From | Interval Picker | -1m (relative time, it goes 1 month into the past from today) |
| To | To | Interval Picker | 1m (same as above, but 1 month into the future, if data exists) |
| Time Period | TimePeriod | Time Period Picker | Day |
| Chart Type | Type | Chart Type Picker | Line |
Options
| zoom | Checkbox | False |
Layout Script
function formatQuarter(d)
{
    if (d instanceof Date)
    {
        var q = d.getMonth();
        q = parseInt(q / 3) + 1;
        return 'Q' + q;
    }
    return '';
}

function formatHalfyear(d)
{
    if (d instanceof Date)
    {
        var q = d.getMonth();
        q = parseInt(q / 6) + 1;
        return 'H' + q;
    }
    return '';
}

var formatDate = d3.time.format("%Y.%m.%d");
var formatDateNice = d3.time.format("%d.%m.%Y");

var node = document.createElement("STYLE")
var textnode = document.createTextNode('body { font-family: Arial,sans-serif; }\ntd { white-space: no-wrap; font-size: 12px}\nth { white-space: no-wrap; font-size: 12px}\ng.today line { stroke:red; }\n')
node.appendChild(textnode)
document.body.appendChild(node)

c3.generate({
    data: chartData,
    grid: {
        y: {
            show: true
        },
        x: {
            show: true,
            lines: [
                {value: new Date(), text: 'today',class: 'today'}
              ]
        }
    },
    zoom: {
        enabled: true
    },
    tooltip: {
        grouped: true,
        contents: function (d, defaultTitleFormat, defaultValueFormat, color) {
            return '<div id="superdupertt" style="border: thin solid black; background-color:white; padding: 3px; white-space: nowrap !important;">'+
                        '<table>'+
                            '<tr>'+
                                '<th colspan="2" style="border-bottom: black thin solid;">' + formatDateNice(d[0].x) + '</th>'+
                            '</tr>' +
                            chartData.custom.versions[formatDate(d[0].x)] +
                        '</table>'+
                    '</div>';
        }
    },
    axis: {
        x: {
            type: 'timeseries',
            label: {
                text: chartData.custom.xLabel,
                position: 'outer-left'
            },
            tick: {
                format: eval(chartData.custom.xTickFormat),
                culling: {
                    max: 25
                },
                fit: true,
                multiline: false
            }
        },
        y: {
            label: 'Versions'
        }
    }
})
Data Script
import com.atlassian.jira.component.ComponentAccessor;
import com.atlassian.jira.project.Project;
import com.atlassian.jira.project.version.Version;
import com.atlassian.jira.util.I18nHelper;

import com.decadis.jira.xchart.api.util.DateUtils;
import com.decadis.jira.xchart.api.model.Period;
import com.decadis.jira.xchart.api.model.ChartData;
import com.decadis.jira.xchart.api.CountGroup;

I18nHelper i18n = ComponentAccessor.getJiraAuthenticationContext().getI18nHelper();

def data = chartBuilder.newDataCollector();
def versions = new HashMap();

Date from = chartBuilder.getDateFromParam(From);
Date to = chartBuilder.getDateFromParam(To);

for ( String p : Projects ) {
    Project proj = ComponentAccessor.projectManager.getProjectByCurrentKey(p)

    for ( Version v : ComponentAccessor.versionManager.getVersions(proj.id) ) {
        if ( v.getReleaseDate() != null && (from == null || v.getReleaseDate().compareTo(from) >= 0) && (to == null || v.getReleaseDate().compareTo(to) < 0) ) {
            def grpVal = dateUtils.getPeriodGroup(v.releaseDate, Period.DAY)
            def title = '<tr><td style="white-space:nowrap">' + proj.name + '</td><td style="white-space:nowrap"><b> - ' + v.name + '</b></td></tr>';
            if ( versions.get(grpVal) )
            {
              title = versions.get(grpVal) + title
            }
            versions.put(grpVal, title)
            data.addValue(BigDecimal.ONE, proj.name, grpVal)
        }
    }
}

for ( java.util.Map.Entry<String, CountGroup> e : data.entrySet() ) {
  e.getValue().accumulate(e.getValue().keySet());
}

def chartData = chartBuilder.newChartData("Versions");
chartData.setPeriod(Period.fromString(TimePeriod));
chartData.setxFormat(DateUtils.SimpleDateFormatD3);
chartData.setType(Type);
chartData.addCustomData("versions", versions);
chartData.addCustomData("today", i18n.getText("xchart.today"));

chartBuilder.getChartUtil().transformResult(data, chartData, true)

return chartData;
If you still have questions, feel free to refer to our support team.