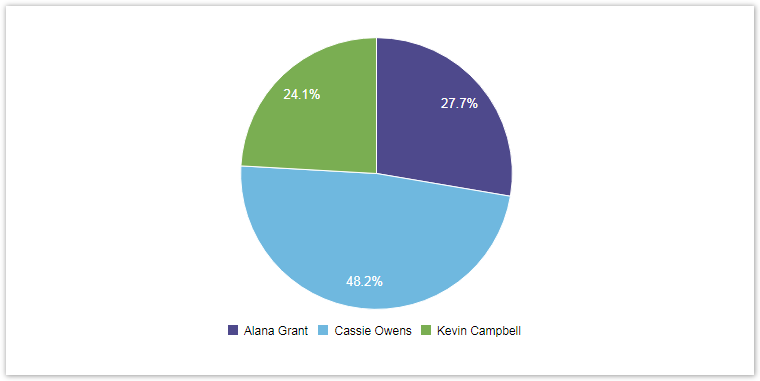
The who's working chart displays which user logged on an issue, in a percentage pie chart.
Chart preview
Parameters
| Parameter | Type | |
|---|---|---|
| UI | Code | |
| Issue | Issue | Issue Picker (single issue) |
Layout Script
Used layout: Timeseries All
function formatTooltipAsHours(value, ratio, id, index)
{
    return value.toFixed(2) + ' h';
}

function formatQuarter(d)
{
    if (d instanceof Date)
    {
        var q = d.getMonth();
        q = parseInt(q / 3) + 1;
        return 'Q' + q;
    }
    return '';
}

function formatHalfyear(d)
{
    if (d instanceof Date)
    {
        var q = d.getMonth();
        q = parseInt(q / 6) + 1;
        return 'H' + q;
    }
    return '';
}

var c3arg = {
    onrendered: updateFrameHeight,
    data: chartData,
    grid: {
        y: {
            show: true
        },
        x: {
            show: true
        }
    },
    axis: {
        x: {
            type: 'timeseries',
            label: {
                text: chartData.custom.xLabel,
                position: 'outer-left'
            },
            tick: {
                format: eval(chartData.custom.xTickFormat),
                culling: {
                    max: 25
                },
                fit: true,
                multiline: false
            }
        },
        y: {
            label: chartData.ytype
        }
    }
};

if (chartData.custom && chartData.custom.tooltip)
{
    var tooltipFunction = eval(chartData.custom.tooltip);
    c3arg.tooltip = {
        format: {
            value: tooltipFunction
        }
    };
}

if ( chartData.custom && chartData.custom.gauge_max)
{
    c3arg.gauge = {
        max: parseFloat(chartData.custom.gauge_max)
    };
}

c3.generate(c3arg);
Data Script
import java.math.BigDecimal;
import java.text.DateFormat;
import java.util.Calendar;

import com.atlassian.jira.component.ComponentAccessor;
import com.atlassian.jira.issue.IssueManager;

import com.atlassian.jira.issue.worklog.Worklog;
import com.atlassian.jira.issue.worklog.WorklogManager;

import com.atlassian.jira.util.I18nHelper;
import com.atlassian.jira.issue.Issue;
import com.decadis.jira.xchart.api.model.Period;
import com.decadis.jira.xchart.api.util.DateUtils;
import com.decadis.jira.xchart.api.model.ChartData;

def i18n = ComponentAccessor.getJiraAuthenticationContext().getI18nHelper();

DateFormat dateFormat = DateUtils.GetDateformat("yyyy.MM.dd");
WorklogManager wlm = ComponentAccessor.getWorklogManager();
IssueManager im = ComponentAccessor.getIssueManager();

def metaCountGroup = chartBuilder.newDataCollector();

for ( Worklog wl : wlm.getByIssue(im.getIssueObject(IssueParam)) )
{
  Calendar cwCreated = dateUtils.getStartOfPeriod(wl.getCreated(), Period.MONTH);
  String cw = dateFormat.format(cwCreated.getTime());
  metaCountGroup.addValue(BigDecimal.valueOf(wl.getTimeSpent()), wl.getAuthorObject() != null ? wl.getAuthorObject().getDisplayName() : "Unknown", cw);
}

def chartData = chartBuilder.newChartData(i18n.getText("common.concepts.time.spent"));
chartData.setxFormat("%Y.%m.%d");
chartData.setType("pie");

chartBuilder.getChartUtil().transformResult(metaCountGroup, chartData, true);

return chartData;
If you still have questions, feel free to refer to our support team.