Get started

Dashboard widgets

Use cases

Additional product info

Versions Compared

Key

  • This line was added.
  • This line was removed.
  • Formatting was changed.

With this Two Dimensional Widget you can easily summarize key metrics like gain an overview of your work hours and revenue for your project per task. Tasks are saved as items on boards in monday.com.

By creating a widget to group these metrics by the status of the tasks, you can view the summed up work hours and revenue for all tasks with a status of "Working on it", "Done" and "Stuck". This helps you to gain a quick overview of the overall status and progress of your project.

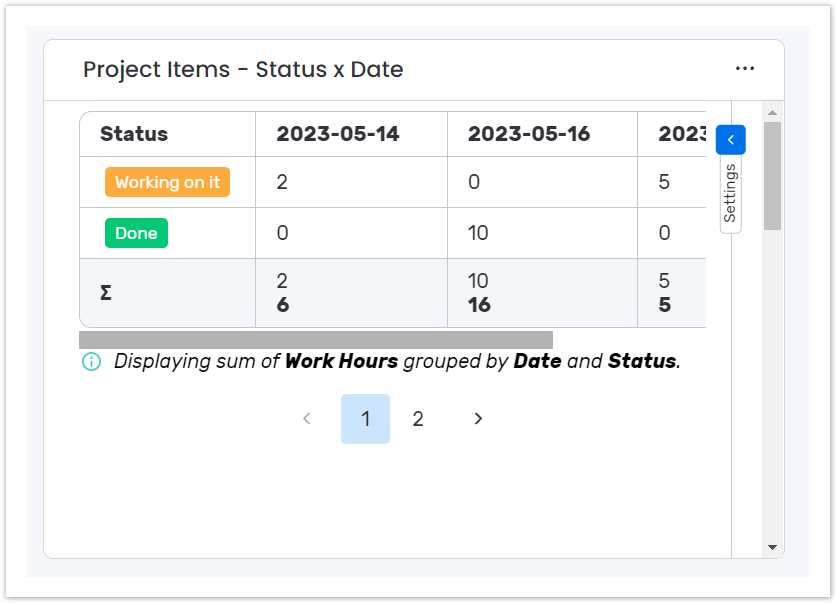
grouped by status and date.

It is essential to keep track of how much time your team needs to work on tasks. With this matrix you can view the sum of work hours for a certain date split up by status of the tasks at one glance.

Image AddedImage Removed

UI Steps
UI Step

Add a new Group By Two Dimensional Widget to your board after creating a dashboard or selecting an existing one.

Add two columns a column of the data type Numbers logging work hours and revenue per per task and a column of the data type Status logging the status of the task.

UI Step

Go to Settings to configure the Group By Two Dimensional Widget. Select Work Hours and Revenue under Choose which columns to show Column to be calculated.

Image RemovedImage Added

UI Step

Under Group items byx-axis select the date column. This groups the work hours by date of the task along the x-axis of the table.

Image Added

UI Step

Under Group y-axis select the status column. This groups the work hours and the revenue by the set status of the task along the y-axis of the table.

Image RemovedImage Added