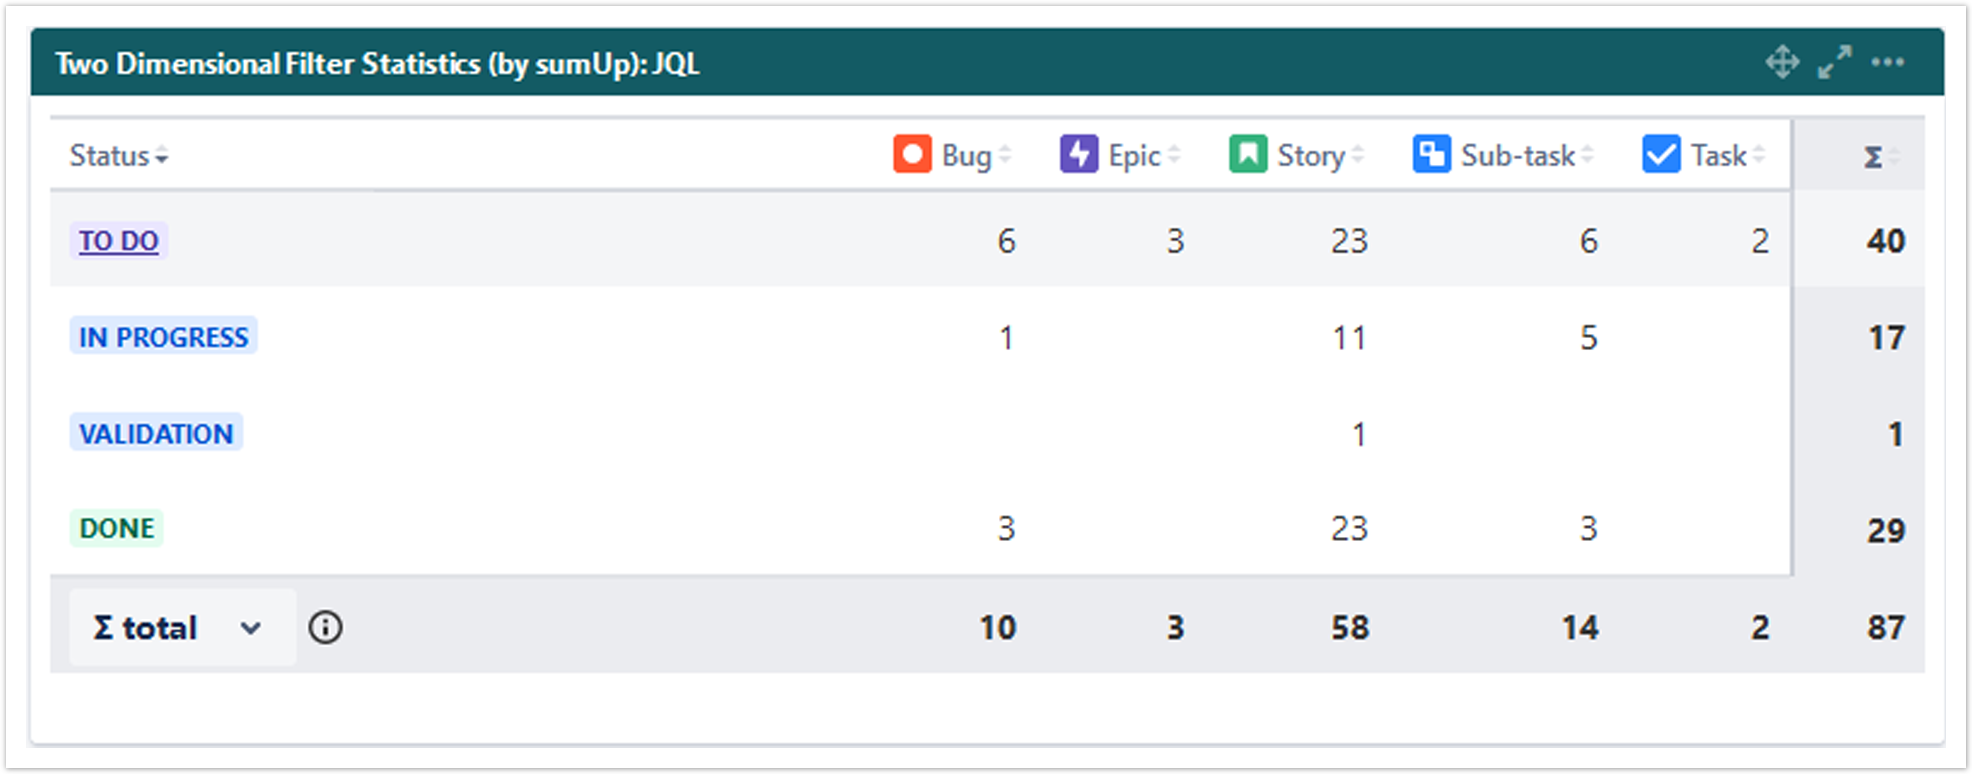
The Two Dimensional Filter Statistics Gadget works like the built-in Two Dimensional Filter Statistics gadget for Jira extended by a total column as well as a total row for a numeric custom field.


Configuration

Optionally, type in a name for the gadget.

Select an existing filter or choose to enter custom JQL

Only available if Custom JQL was selected in the Filter parameter. 

No need to create hundreds of filters to be used in various gadgets - simply define the result set by adding custom JQL! 

Select the field that you want to calculate a sum for.

Only certain fields can actually be summed up (e.g numeric fields, text fields with numeric values etc.) 

Select a field that will be used to group the results by on the X-axis.

Select a field that will be used to group the results by on the Y-axis.

Choose how many results you want to display on your dashboard.

If you have chosen to group the data by a date (e.g. Due date), you can set a default time period for the displayed data when the gadget is loaded or refreshed.

You can choose between: 

  • Current week
  • Current month
  • Current quarter
  • Current year
  • All-time

If you have chosen to group the data by a date (e.g. Due date), you can set a default aggregation level for the displayed data when the gadget is loaded or refreshed.

  • Daily
  • Weekly
  • Monthly
  • Quarterly
  • Yearly

 You can choose between: 

  • Never
  • Every 15 Minutes
  • Every 30 Minutes
  • Every 1 Hour
  • Every 2 Hours

If Never is selected, the gadget will only be refreshed on page reload.


View mode

The colums can be sorted by clicking on the small arrows next to each colum header. 

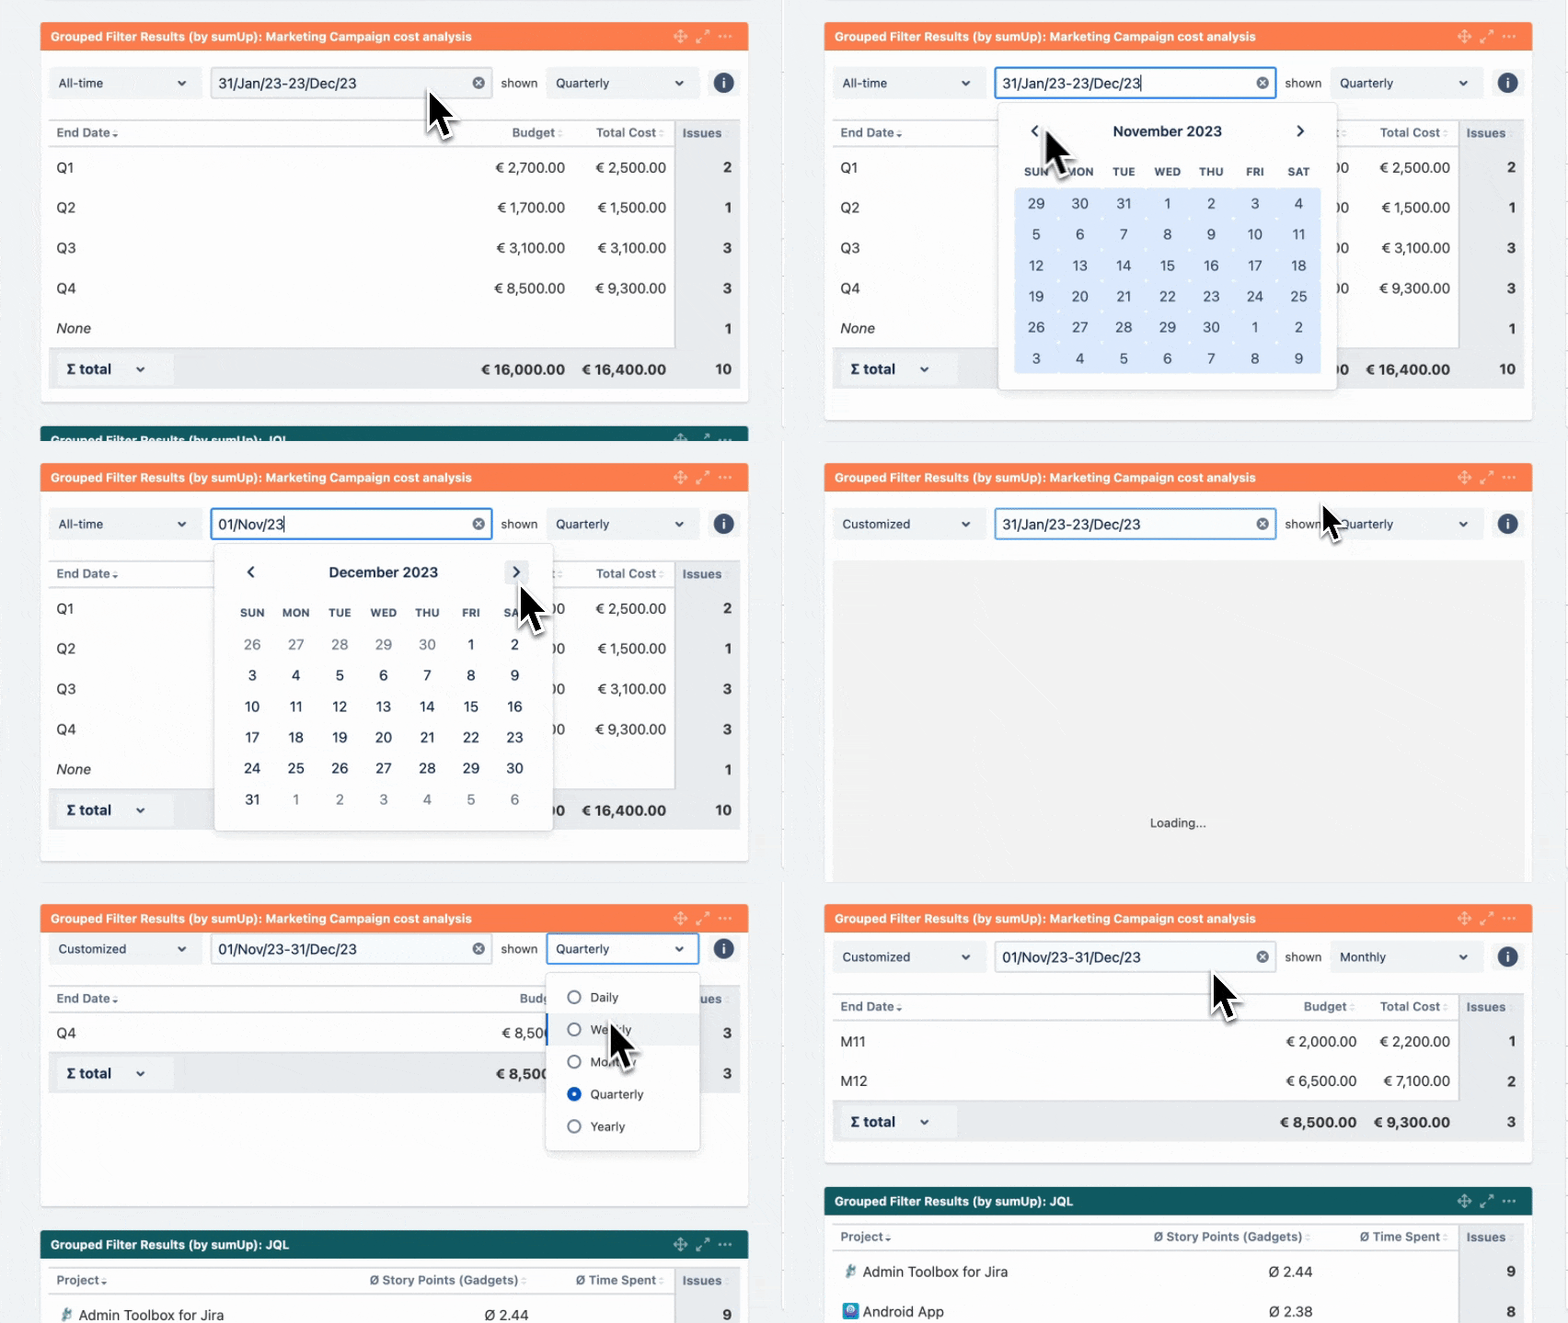
The gadget displays an additional filter at the top when a date field is selected in the configuration.

Initially, it is pre-populated with the value set in the configuration and the data is displayed accordingly. 

It contains the following options:

OptionDescription
Time Period

The drop-down menu contains the options in the following order:

  • Current week
  • Current month
  • Current quarter
  • Current year
  • All-time
Date picker

The picker allows you to override the Time Period selection.

You can select the start and end dates of the aggregated data by clicking first on the start date and then on the end date.

To enter your chosen date, click next to the expanded calendar.

If the date range is not customized, it reflects the chosen Time period. For example, the period selection would display 01/Jan/24-31/Dec/24 if the Current year option is selected. If the date range is adjusted, the Date Filter View changes to Customized.

Date grouping

The selector determines how the data is grouped in the columns/rows of the table.

The drop-down menu contains the following options:

  • Daily shown as separate dates. 
  • Weekly shown as W1, W2, W3,...
  • Monthly shown as M1, M2, M3,...
  • Quarterly shown as Q1, Q2, Q3, Q4
  • Yearly shown as Y/22, Y/23, Y/24, ...

If the data spans more than one year, the Weekly, Monthly and Quarterly data are shown with the year as suffix, e.g. Q1/24.

Info icon

The tooltip displays information about the data displayed in the gadget.


You can choose between the overall ∑ total or the total of the ∑ page. Or you can choose between the Ø total or the Ø page, if you have selected average fields. 


Use cases and examples