Page History
| UI Text Box | ||||
|---|---|---|---|---|
| ||||
| As a marketing team, we understand that it is important to keep track of your expenses. You will be able to see the difference in no time! That is why sumUp is here to help! Our Grouped Filter Results gadget makes it easy to compare your actual costs with your budget. In this example, you will learn how to use sumUp to compare the budget and last year's budget and costs per quarter. |
| Warning | ||||||
|---|---|---|---|---|---|---|
|
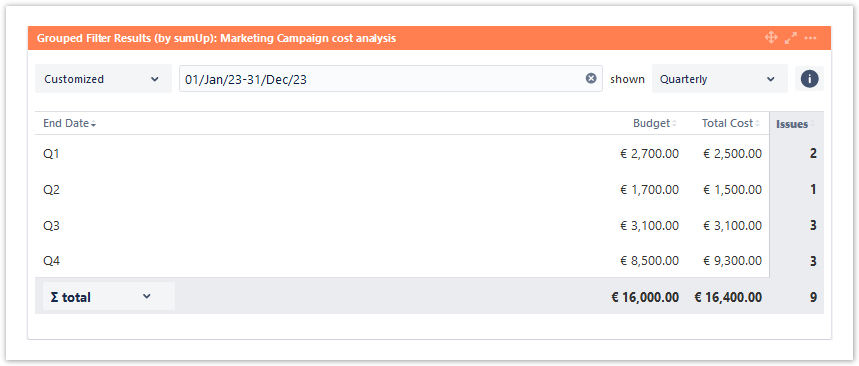
As you can see, we have configured the gadget so that you can see the budget for each quarter and the total cost and number of issues. On the bottom of the gadget you can see the total budget for the year and the total cost and total number of issues. At the top you can see the options to select a different time period.
| UI Text Box | ||
|---|---|---|
| ||
| You can tweak the date options on top of the gadget at any time without destroying your configurations. |
Configuration
| Option | Settings |
|---|---|
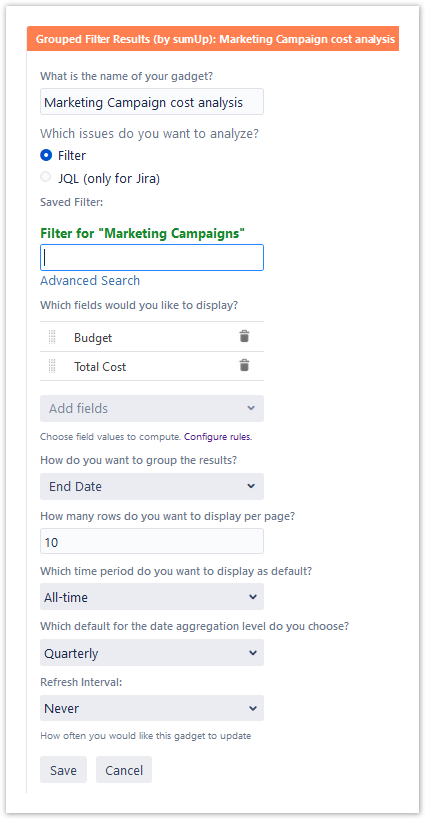
| What is the name of your gadget? | A precise name like Marketing Campaign cost analysis makes it easy to locate the gadget on the dashboard. |
| Which issues do you want to analyze? | Before "Before Filter" can be chosen, there has to be set a Filter for the . For this project the Filter Marketing Campaigns contains the whole project. |
| Which fields would you like to display? | To use the custom number custom fields "Budget" and " and Total Costs" you have to creat create a custom calculation rule. By clicking "Add fields", you can search for "Budget" and "Total Cost" and add them.Then select the fields in the gadget. |
| How do you want to group the results? | Group the results by "End Date" to ensure the costs are correctly grouped. " End Date" is a custom date field that must also be created. |
| How many rows do you want to display per page? | The default is a good choice because there is only one year to display.For a quarterly view, there are only four entries. Therefore, the default option of 10 rows is enough. |
| Which time period do you want to display as default? | To view all data, select "select All-time". |
| Which default for the date aggregation level do you choose? | If you choose the "the Quarterly" option, the data is displayed per quarter. |
| Refresh Interval: | The gadget will refresh automatically when the side is reloaded, if you choose "choose Never". |
| Page properties | ||||
|---|---|---|---|---|
| ||||
|