Page History
| UI Text Box | ||||
|---|---|---|---|---|
| ||||
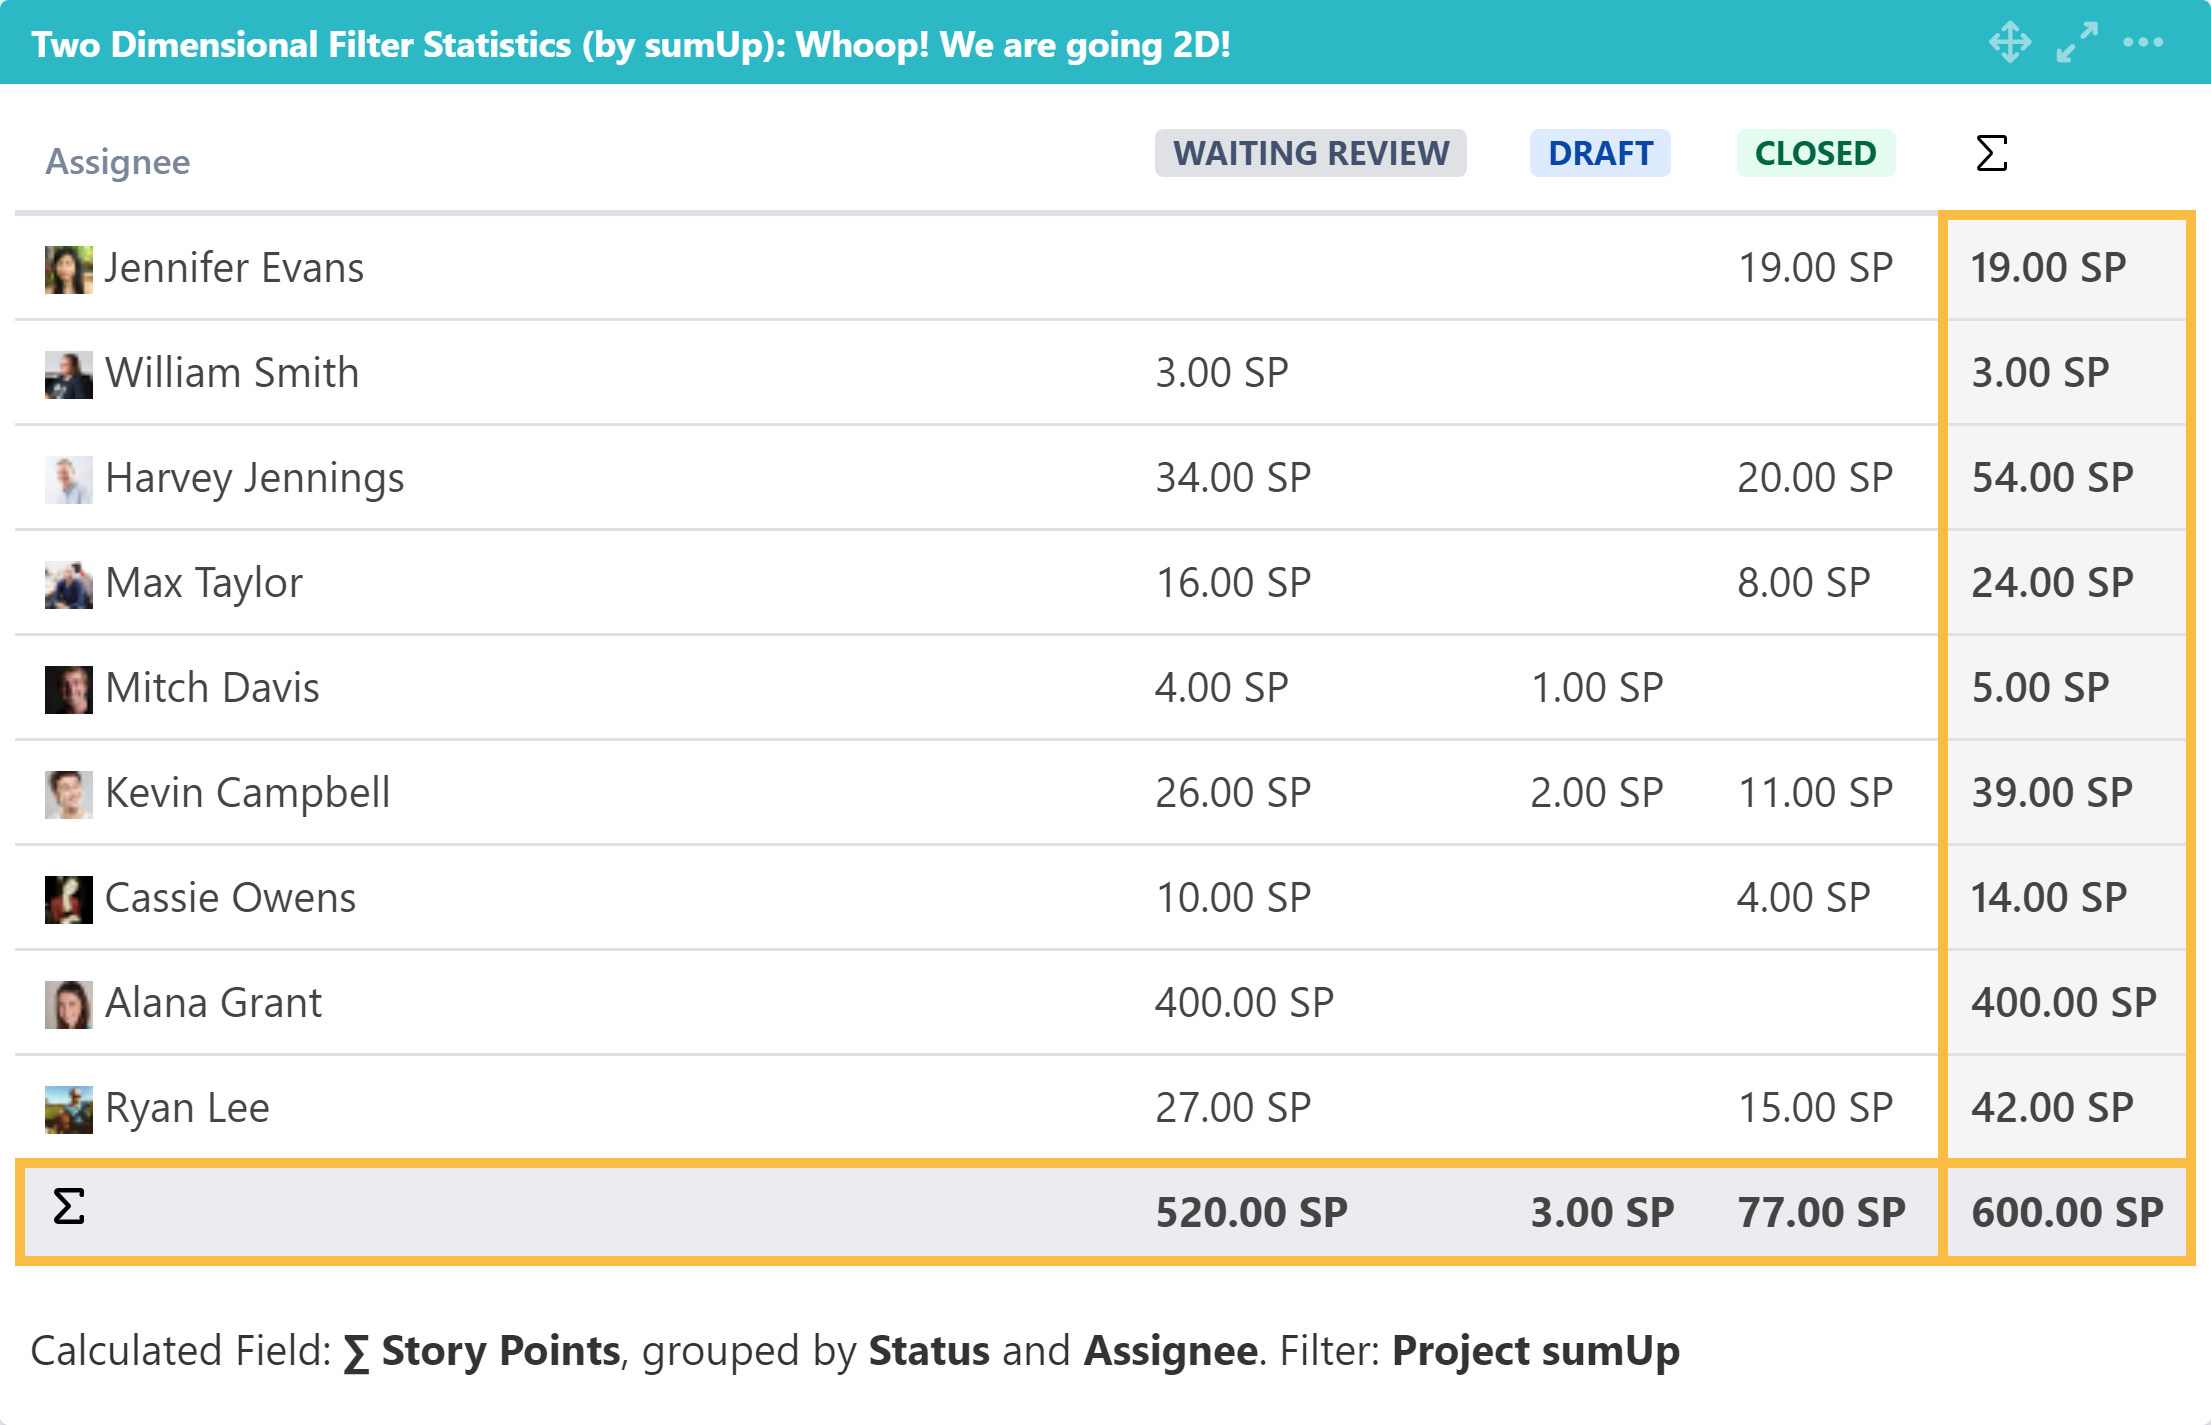
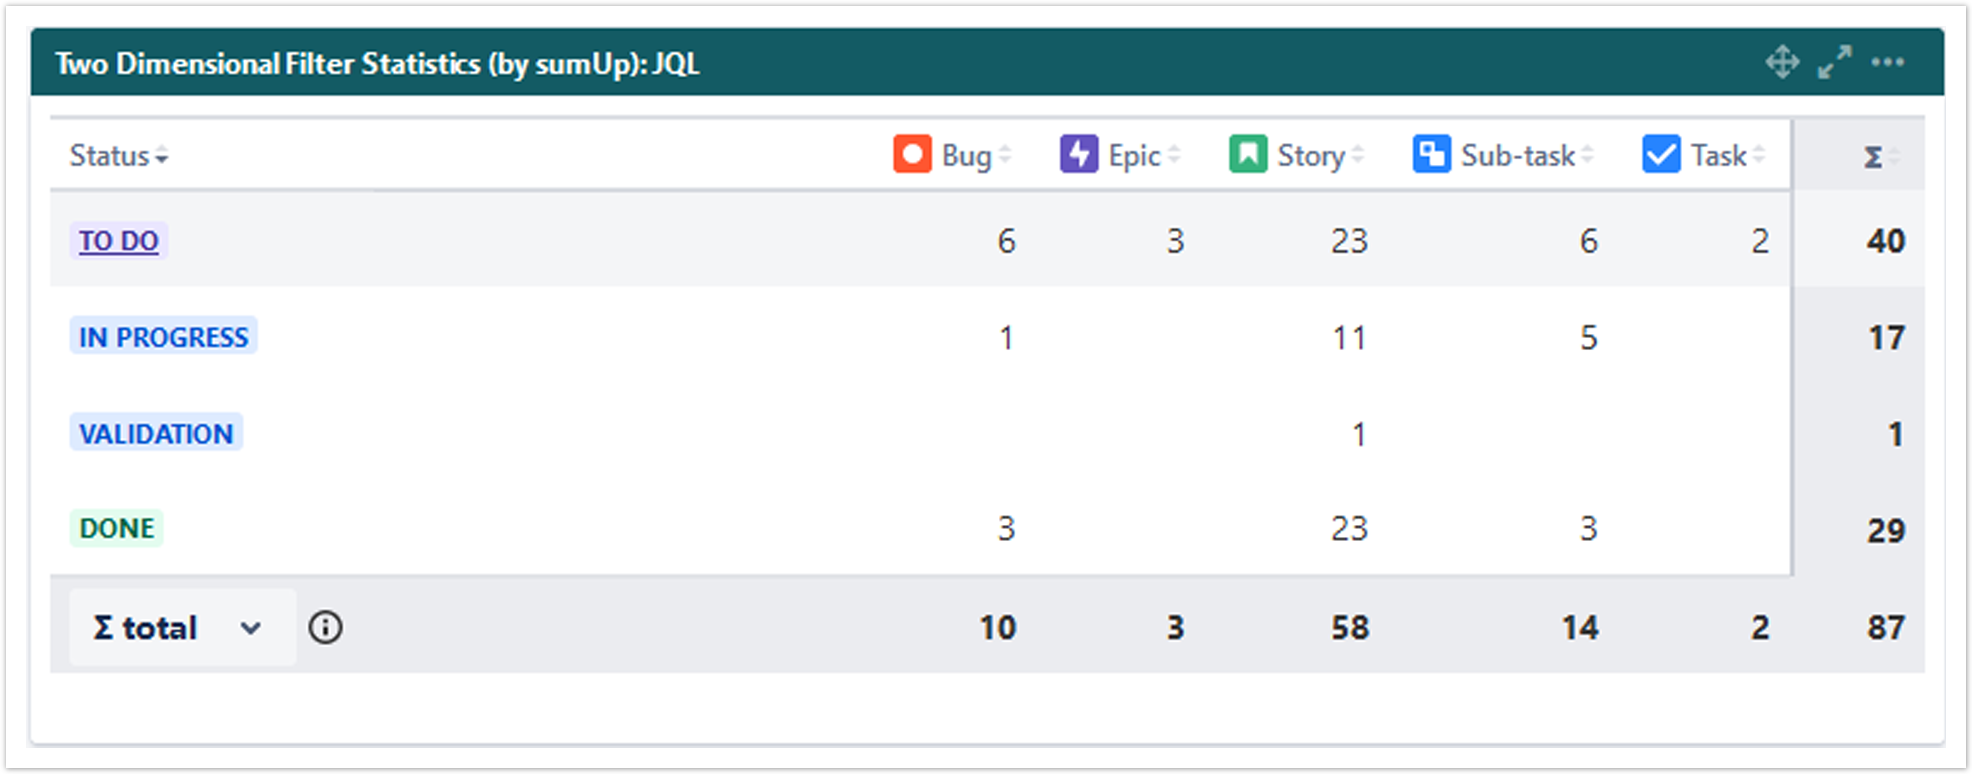
What does this gadget offer? The Two Dimensional Filter Statistics Gadget works like the built-in Two Dimensional Filter Statistics gadget for Jira Jira extended by a total column as well as a total row for a numeric custom field. |

 Configuration
| UI Expand | |||
|---|---|---|---|
| |||
Optionally, type in a name for the gadgetAdd a custom title to the gadget for easier identification. If nothing is set, the title will be generated by combining the gadget name and the selected filter/ JQL. |
| UI Expand | |||
|---|---|---|---|
| |||
Select an existing filter or choose to enter custom JQL. |
| UI Expand | |||||||||||
|---|---|---|---|---|---|---|---|---|---|---|---|
| |||||||||||
|
| UI Expand | ||||||||||
|---|---|---|---|---|---|---|---|---|---|---|
| ||||||||||
Select the field that you want to calculate a sum for. | Filter Results gadget (by sumUp) | Filter Results gadget (by sumUp) | nopanel | true
| UI Text Box | ||
|---|---|---|
| ||
The sum/ average of the field will only be displayed, if a calculation rule has been created. |
Only certain fields can actually be summed up (e.g numeric fields, text fields with numeric values etc.) |
| UI Expand | ||
|---|---|---|
| ||
Select a field that will be used to group the results by on the X-axis. |
| UI Expand | ||
|---|---|---|
| ||
Select a field that will be used to group the results by on the Y-axis. |
| UI Expand | ||
|---|---|---|
| ||
Choose how many results you want to display on your dashboard. |
| UI Expand | ||||||
|---|---|---|---|---|---|---|
| ||||||
If you have chosen to group the data by a date (e.g. Due date), you can set a default time period for the displayed data when the gadget is loaded or refreshed. You can choose between:
|
| UI Expand | ||||||
|---|---|---|---|---|---|---|
| ||||||
If you have chosen to group the data by a date (e.g. Due date), you can set a default aggregation level for the displayed data when the gadget is loaded or refreshed.
|
| UI Expand | ||
|---|---|---|
| ||
You can choose between:
Specify how often the gadget should be refreshed.
|
 View mode
| UI Expand | ||
|---|---|---|
| ||
| The colums can be sorted by clicking on the small arrows next to each colum header. |
| UI Expand | ||||||||||||||||||||||||||||||||||||||||
|---|---|---|---|---|---|---|---|---|---|---|---|---|---|---|---|---|---|---|---|---|---|---|---|---|---|---|---|---|---|---|---|---|---|---|---|---|---|---|---|---|
| ||||||||||||||||||||||||||||||||||||||||
It contains the following options:
|

| UI Expand | ||||||
|---|---|---|---|---|---|---|
| ||||||
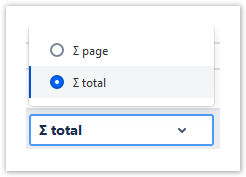
You can choose between theoverall ∑ total or thetotal of the ∑ page. Or you can choose between the Ø total or the Ø page, if you have selected average fields.
|
Use cases and examples
| Page properties report | ||||||
|---|---|---|---|---|---|---|
|
| Excerpt Include | ||||||
|---|---|---|---|---|---|---|
|