Page History
| UI Text Box | ||||
|---|---|---|---|---|
| ||||
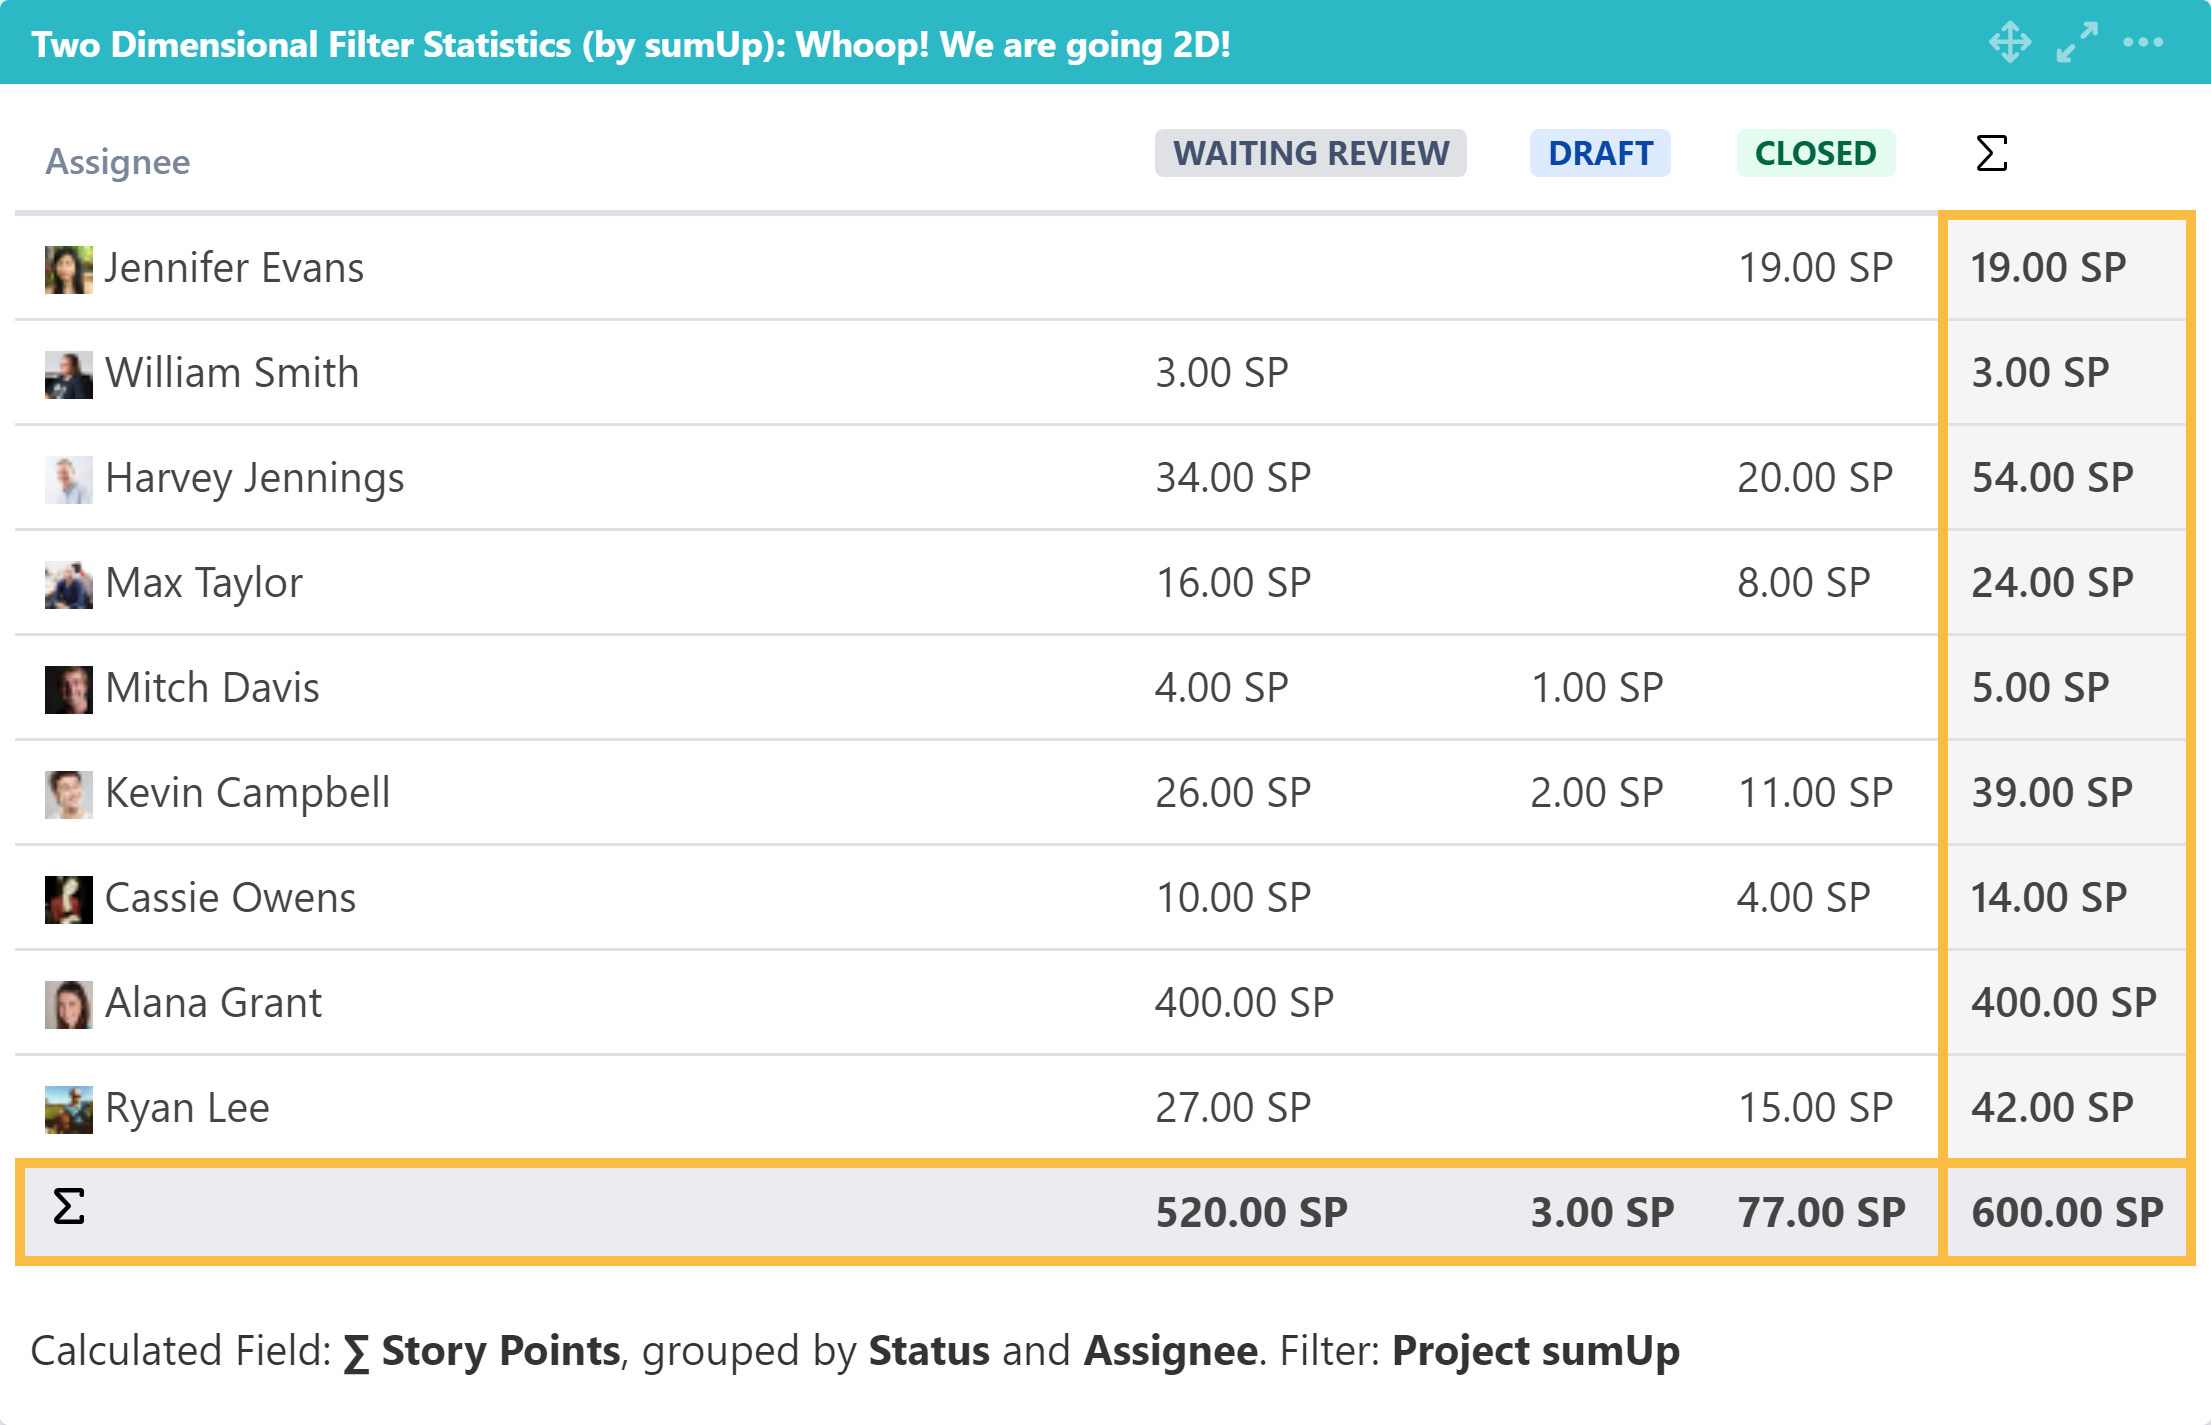
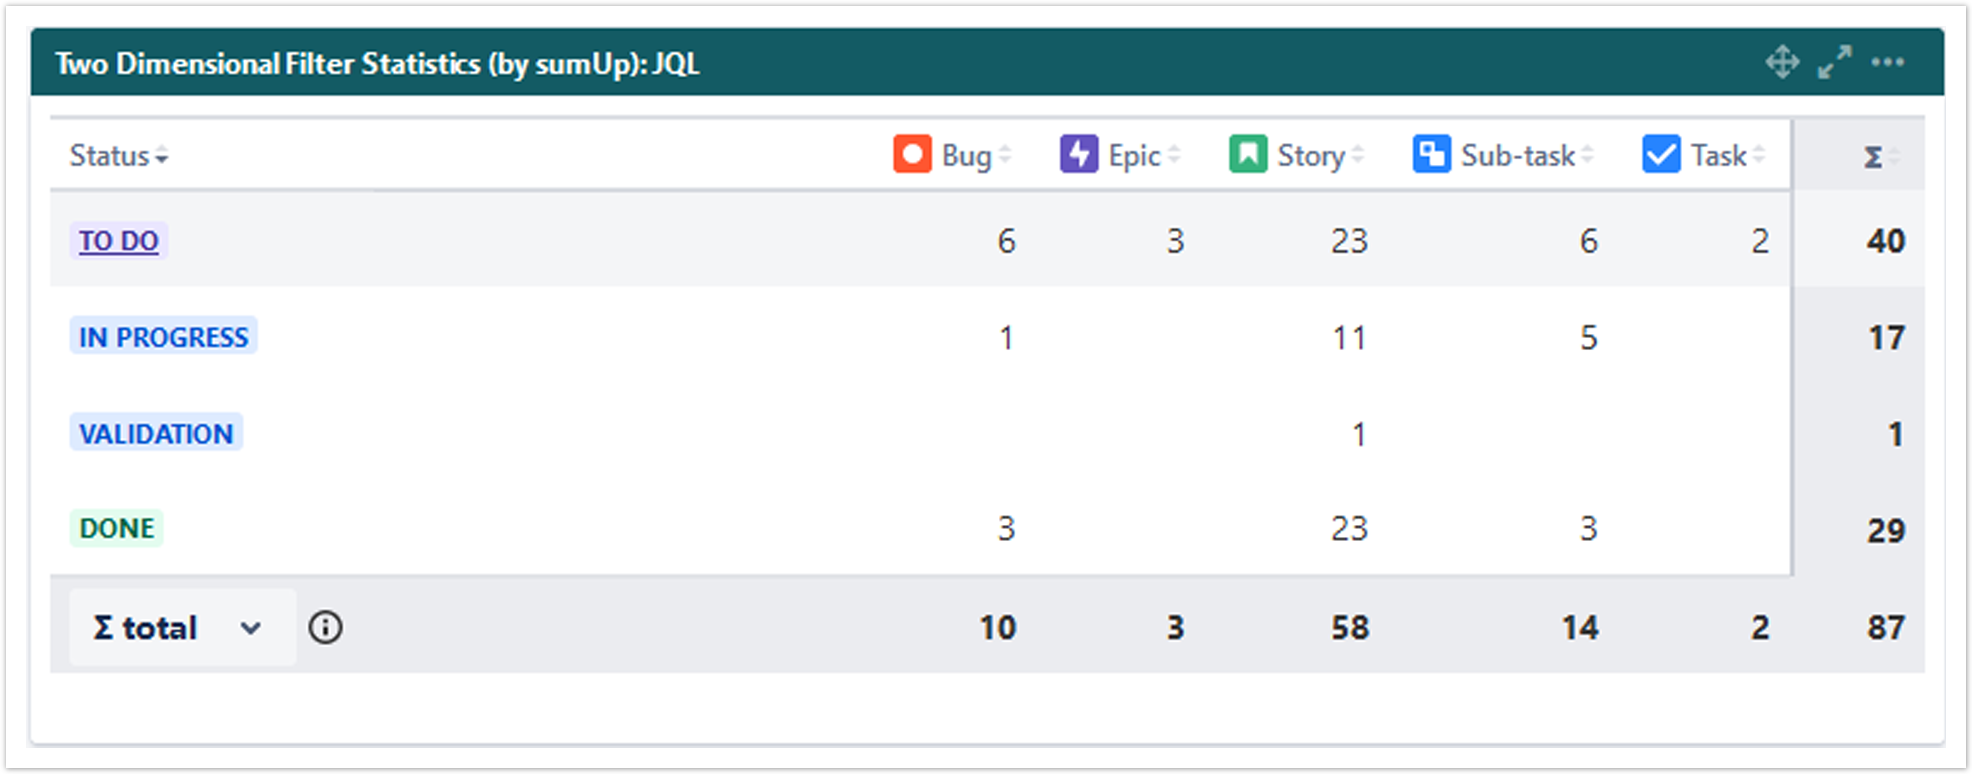
What does this gadget offer? The Two Dimensional Filter Statistics Gadget works like the built-in Two Dimensional Filter Statistics gadget for Jira Jira extended by a total column as well as a total row for a numeric custom field. |

 Configuration
| UI Expand | |||
|---|---|---|---|
| |||
Optionally, type in a name for the gadgetAdd a custom title to the gadget for easier identification. If nothing is set, the title will be generated by combining the gadget name and the selected filter/ JQL. |
| UI Expand | |||
|---|---|---|---|
| |||
Select an existing filter or choose to enter custom JQL. |
| UI Expand | |||||||||||
|---|---|---|---|---|---|---|---|---|---|---|---|
| |||||||||||
|
| UI Expand | ||||||||
|---|---|---|---|---|---|---|---|---|
| ||||||||
Select the field that you want to calculate a sum for.
Excerpt Include | | Filter Results gadget (by sumUp) | Filter Results gadget (by sumUp) | |||||
| nopanel | true |
Only certain fields can actually be summed up (e.g numeric fields, text fields with numeric values etc.) |
| UI Expand | ||
|---|---|---|
| ||
Select a field that will be used to group the results by on the X-axis. |
| UI Expand | ||
|---|---|---|
| ||
Select a field that will be used to group the results by on the XY-axis. |
| UI Expand | ||
|---|---|---|
| ||
Choose how many results you want to display on your dashboard. excerpt |
| ui- | ||||||||
|---|---|---|---|---|---|---|---|---|
| Expand | ||||||||
| ||||||||
| ||||||||
If you have chosen to group by their name instead of the ID:
By default, the values will be grouped by their ID, meaning that there might be several options that have the same name (e.g. 2 components from different projects) but since they don't have the same ID in the database, they will be treated as two different values. When checking the checkbox, options with the same value will be treated as one option, even though they are saved as different values in the database. 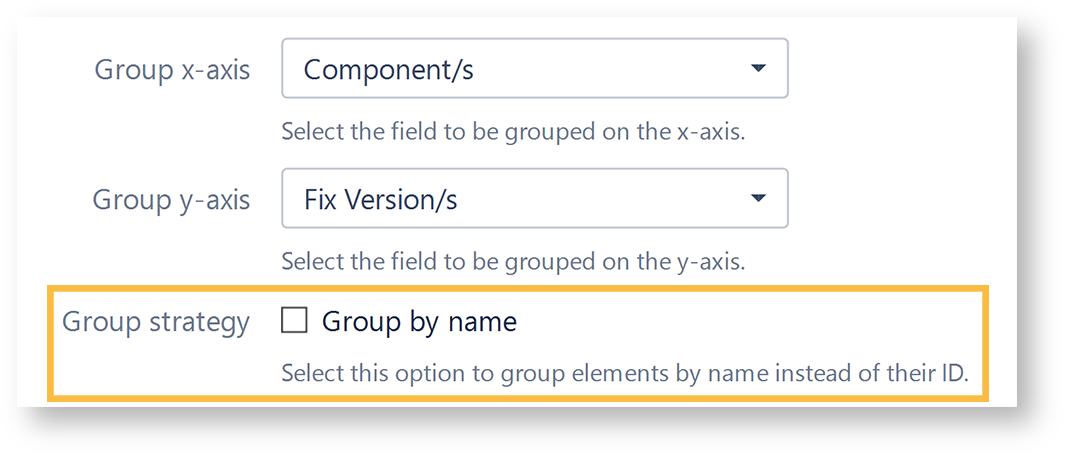 the data by a date (e.g. Due date), you can set a default time period for the displayed data when the gadget is loaded or refreshed. You can choose between:
|
| UI Expand | ||||||
|---|---|---|---|---|---|---|
| ||||||
If you have chosen to group the data by a date (e.g. Due date), you can set a default aggregation level for the displayed data when the gadget is loaded or refreshed.
|
| UI Expand | ||
|---|---|---|
| ||
You can choose between:
|
 View mode
| UI Expand | |||||
|---|---|---|---|---|---|
| |||||
| Excerpt Include | Two Dimensional Filter Statistics gadget | Two Dimensional Filter Statistics gadget | |||
| nopanel | true |
| UI Expand | ||
|---|---|---|
| ||
Choose how many results you want to display on your dashboard. |
| title | Refresh interval |
|---|
Specify how often the gadget should be refreshed.
If Never is selected, the gadget will only be refreshed on page reload.
| |
| The colums can be sorted by clicking on the small arrows next to each colum header. |
| UI Expand | ||||||||||||||||||||||||||||||||||||||||
|---|---|---|---|---|---|---|---|---|---|---|---|---|---|---|---|---|---|---|---|---|---|---|---|---|---|---|---|---|---|---|---|---|---|---|---|---|---|---|---|---|
| ||||||||||||||||||||||||||||||||||||||||
It contains the following options:
|

| UI Expand | ||||||
|---|---|---|---|---|---|---|
| ||||||
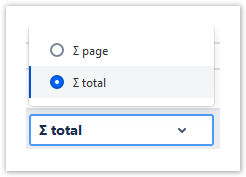
You can choose between theoverall ∑ total or thetotal of the ∑ page. Or you can choose between the Ø total or the Ø page, if you have selected average fields.
|
Use cases and examples
| Page properties report | ||||||
|---|---|---|---|---|---|---|
|
| Excerpt Include | ||||||
|---|---|---|---|---|---|---|
|