Analyze log files directly in the administration interface
Analyzing log files is the key to successful troubleshooting. With Last Log for Jira, you can finally analyze all log files directly in the Jira administration interface.
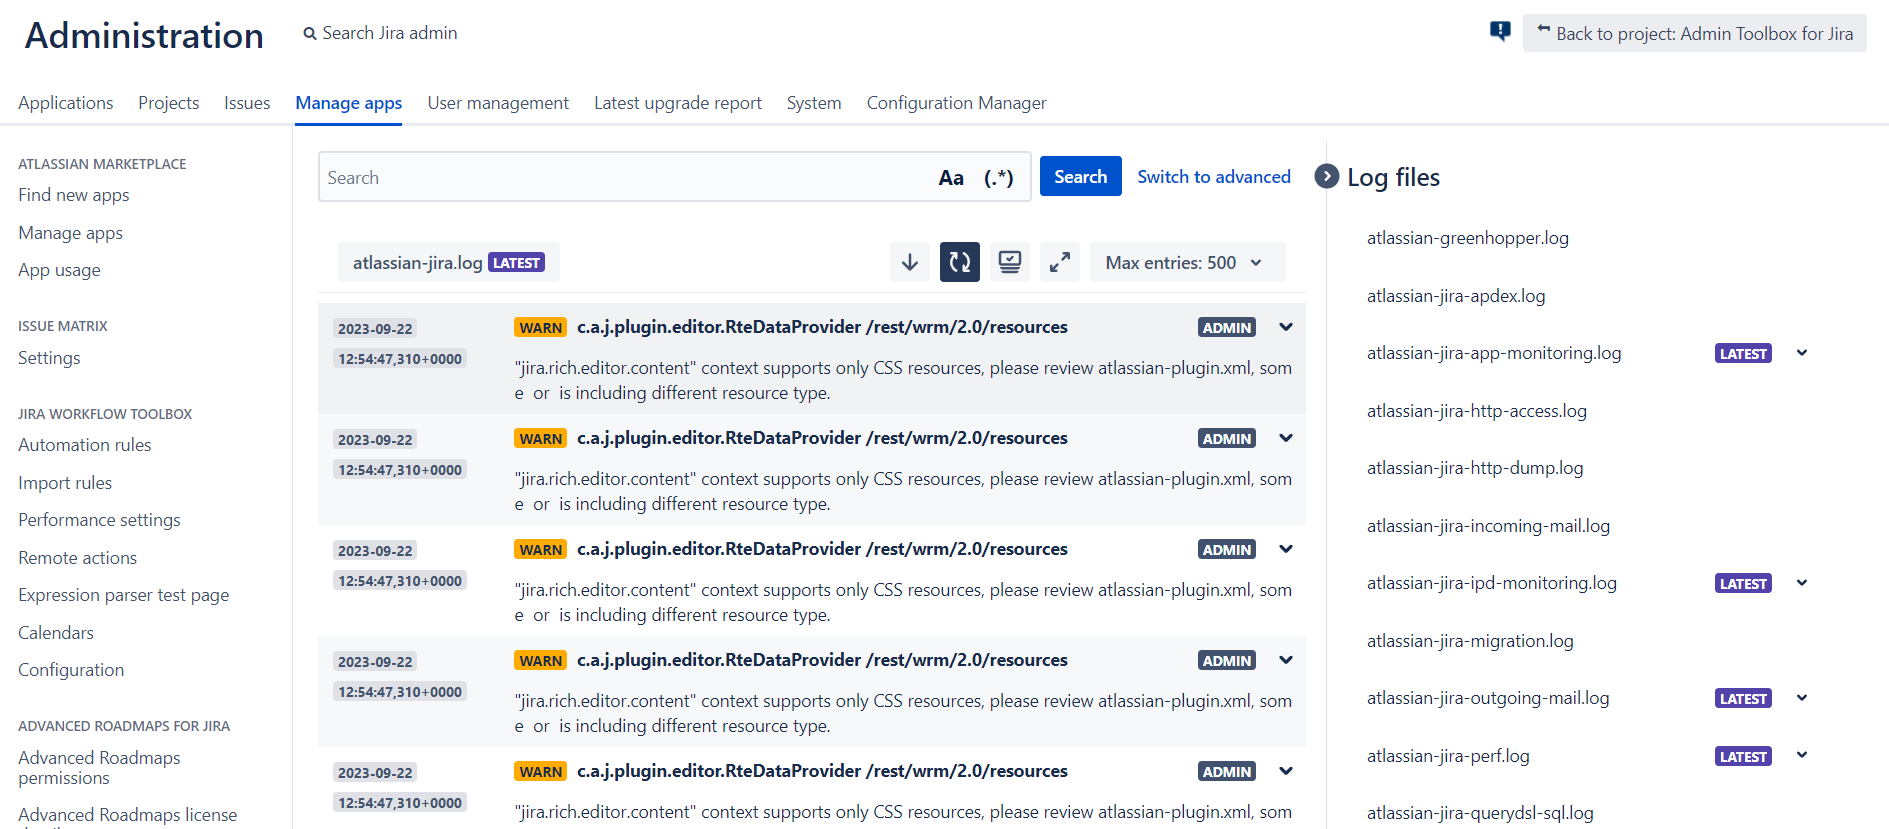
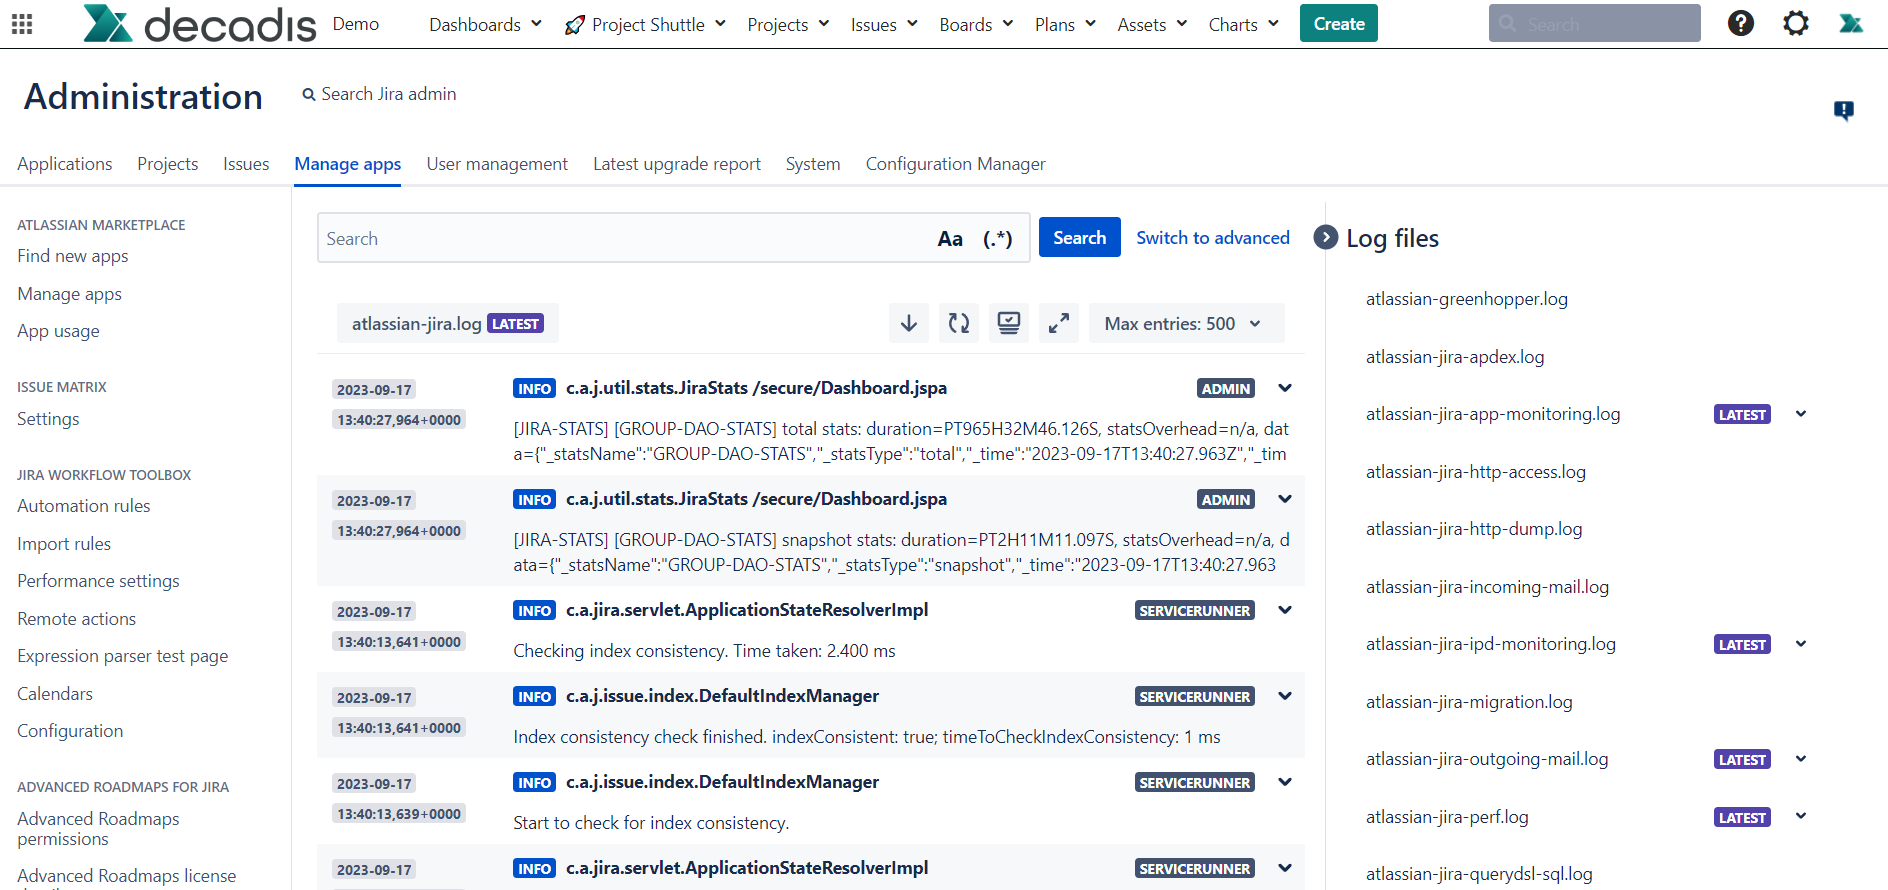
- All log files in a single location - Select the log file you want to analyze from a practical sidebar with dropdown menus.
- Don't lose focus - Use the tool bar to configure your log view and only view exactly the log entries you're looking for.
- View thread dumps - Access a current thread dump for your instance within seconds to analyze performance issues.
Advanced search and filter options
The sheer number of log file entries can be overwhelming and it's easy to miss the exact information you are looking for. Not anymore!
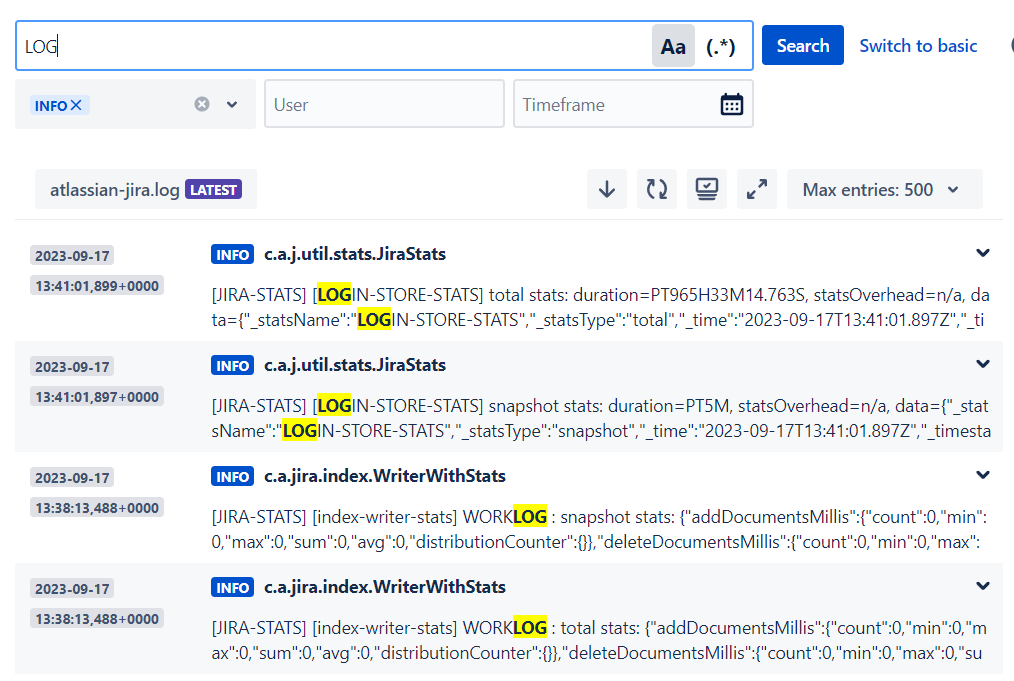
- Advanced search - Search for specific log entries with case sensitive search and regular expressions.
- Filter your output - Configure advanced filters using log level, user name or timeframe of the log entries.
- Limit shown log entries - Limit your output to focus on the essential by using a practical tool bar.
Activate the live view and let your logs be automatically refreshed
By using the tool bar in the log view interface, you can activate a live view of your logs with a single click!
- View your logs almost in real-time with a refresh every 5 seconds.
- New log entries appear automatically, so you can continuously analyze your log.
- Easily deactivate the live view again to focus on the current log entries.