Page History
| Panel | ||||||||
|---|---|---|---|---|---|---|---|---|
On this page
|
| UI Text Box | ||||||
|---|---|---|---|---|---|---|
| ||||||
|
| Multimedia | ||||
|---|---|---|---|---|
|
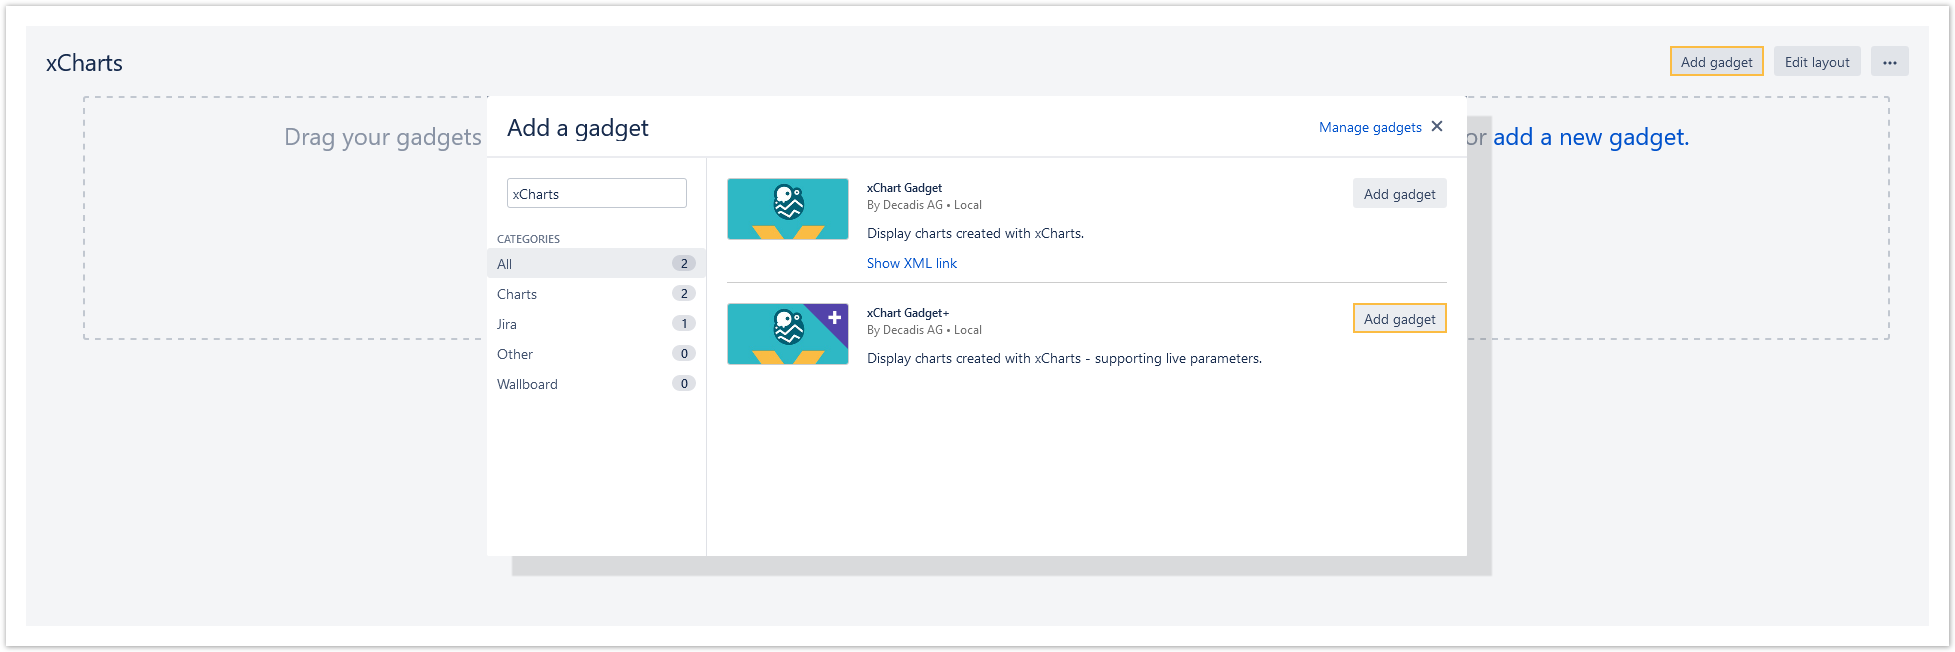
Adding the gadget to the dashboard
The gadget can be added by hitting the "Add gadget" button on the dashboard and searching for "xChart" or "xCharts+":
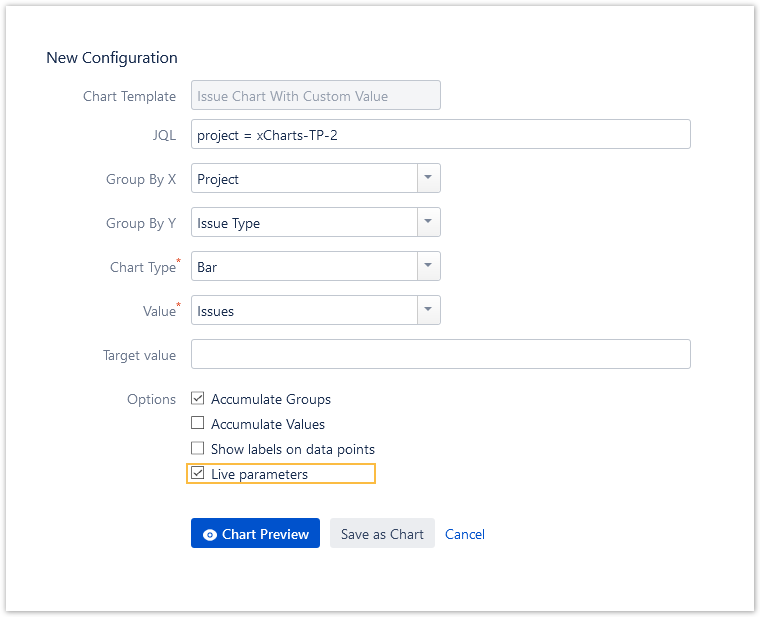
Enabling live parameters configuration
When creating or editing a chart, the checkbox "Live parameters" has to be checked in order to use this chart in the xChart gadget+.
| UI Text Box | ||
|---|---|---|
| ||
Live parameter configuration is currently only available for built-in charts and reports. Scripted charts are currently not supported. |
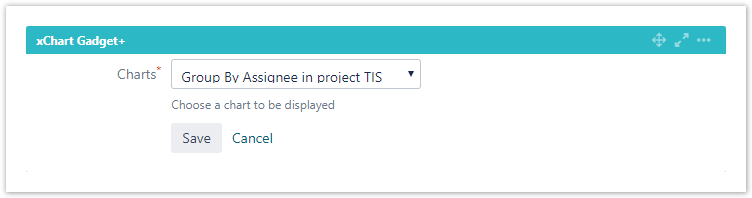
 Configuration
After adding the gadget to the dashboard, available charts to display can be selected:
| UI Text Box | ||
|---|---|---|
| ||
Only charts with enabled "Live parameters" will be listed. |
To configure the gadget simply access the live configuration by clicking on the cog icon in the upper right-hand side.
Once the configuration update is complete confirm by clicking on the "Update" button. This will directly store the changes and the gadget will be immediately updated.
| UI Text Box | ||
|---|---|---|
| ||
Changing the chart by using the live parameters will not affect the initial chart configuration. The changes made will be saved per user. Other users have the possibility to change the chart with live parameters according to their needs without interfering with the configuration of other users. |
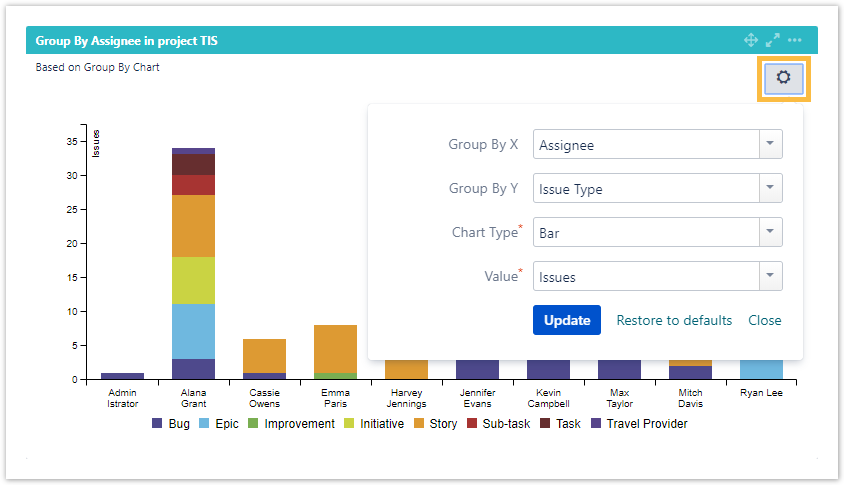
The chart can be easily reset by clicking on "Restore to defaults".
| UI Text Box | ||
|---|---|---|
| ||
Currently only the xChart gadget is supported within Confluence. |
| Excerpt Include | ||||||
|---|---|---|---|---|---|---|
|