Page History
| Panel | ||||||||||
|---|---|---|---|---|---|---|---|---|---|---|
On this page
|
| Content Layout Macro |
|---|
| UI Text Box | ||||
|---|---|---|---|---|
| ||||
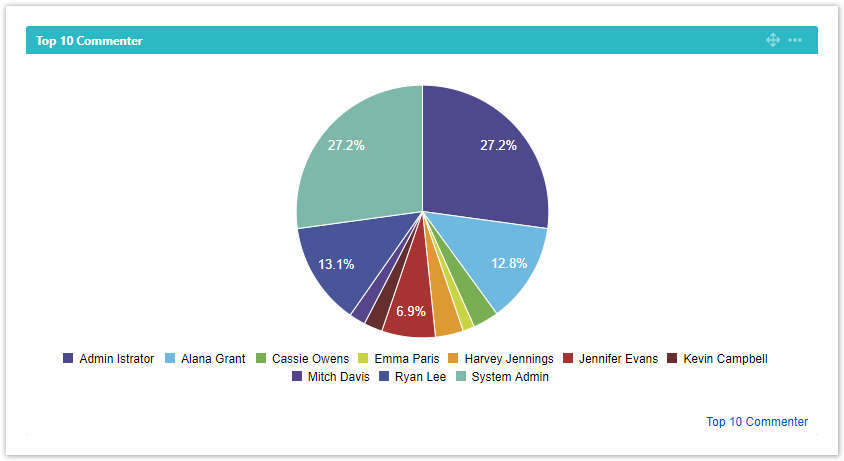
xCharts gadgets can be used for displaying created charts directly on your dashboard with no need for heading over to the xCharts configuration. Currently, there are two gadgets available within xCharts:
|
A glance at the gadgets:
xChart gadget
The xCharts gadget ← (link) displays the charts and reports with the possibility to set a refresh interval and change the background color:
xCharts gadget+
| Status | ||||
|---|---|---|---|---|
|
| Multimedia | ||||||
|---|---|---|---|---|---|---|
|
| UI Text Box | ||
|---|---|---|
| ||
Currently, only the xCharts gadget can be used within Confluence. |
| Excerpt Include | ||||||
|---|---|---|---|---|---|---|
|