Page History
| Page properties | ||
|---|---|---|
| ||
| UI Text Box | ||||
|---|---|---|---|---|
| ||||
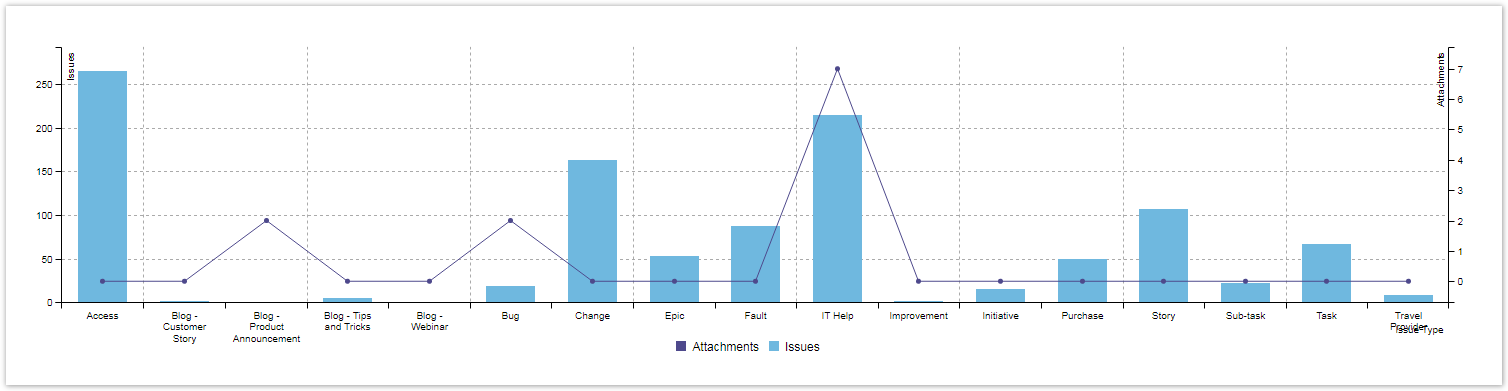
This chart is an example with 2 Y axes, that can be used for correlating values (Money vs. Time Spent, Original Estimate vs. Time Spent), grouped by a certain category. |
| Button Hyperlink | ||||||||
|---|---|---|---|---|---|---|---|---|
|
Chart preview
Parameters
| Name | Type | Default | |
|---|---|---|---|
| UI | Code | ||
JQL | JQL | JQL Autocomplete | |
| Group By X | GroupByX | Group By Picker | Issue Type |
| Values On Y | ValuesOnY | Value Field Picker | IssueCount |
| Values On Y2 | ValuesOnY2 | Value Field Picker | AttachmentCount |
| UI Expand | |||||||||
|---|---|---|---|---|---|---|---|---|---|
| |||||||||
|
| UI Expand | |||||||||
|---|---|---|---|---|---|---|---|---|---|
| |||||||||
|
 Related examples
| Excerpt Include | ||||||
|---|---|---|---|---|---|---|
|