Versions Compared

Key

  • This line was added.
  • This line was removed.
  • Formatting was changed.
Page properties
hiddentrue
DescriptionShows the distribution of working times on a specific issue based on the work log.
Chart preview

Parameters
  • JQL
  • Time Period
  • Chart Type
  • Number of grid lines
  • Target value
  • Live parameters
Chart typeBuilt-In chart
UI Text Box
sizemedium
typeinfo

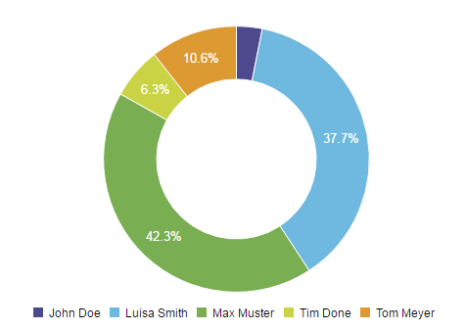
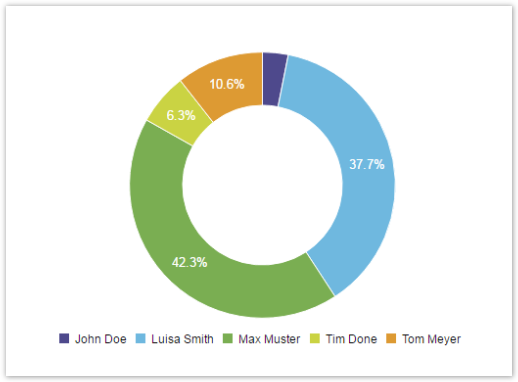
The who's working by JQL chart displays the working times. You can filter by using JQL and group by time-unit.

Chart preview

Parameters

ParameterTypeDefault Value
UICode
JQL
JQL
JQL Autocomplete
Time Period
TimePeriod
Time PeriodMonth
Chart Type
ChartType
Chart Type PickerBar
UI Expand
titleLayout Script
UI Text Box
typenote

Used layout: Timeseries All.

Code Block
languagejs
themeMidnight
linenumberstrue
function formatTooltipAsHours(value, ratio, id, index)
{
    return value.toFixed(2) + ' h';
}
 
function formatQuarter(d)
{
    if (d instanceof Date)
    {
        var q = d.getMonth();
        q = parseInt(q / 3) + 1;
        return 'Q' + q;
    }
    return '';
}
 
function formatHalfyear(d)
{
    if (d instanceof Date)
    {
        var q = d.getMonth();
        q = parseInt(q / 6) + 1;
        return 'H' + q;
    }
    return '';
}
 
var c3arg = {
    onrendered: updateFrameHeight,
    data: chartData,
    grid: {
        y: {
            show: true
        },
        x: {
            show: true
        }
    },
    axis: {
        x: {
            type: 'timeseries',
            label: {
                text: chartData.custom.xLabel,
                position: 'outer-left'
            },
            tick: {
                format: eval(chartData.custom.xTickFormat),
                culling: {
                    max: 25
                },
                fit: true,
                multiline: false
            }
        },
        y: {
            label: chartData.ytype
        }
    }
};
 
if (chartData.custom && chartData.custom.tooltip)
{
    var tooltipFunction = eval(chartData.custom.tooltip);
    c3arg.tooltip = {
        format: {
            value: tooltipFunction
        }
    };
}
 
if ( chartData.custom && chartData.custom.gauge_max)
{
    c3arg.gauge = {
        max: parseFloat(chartData.custom.gauge_max)
    };
}
 
c3.generate(c3arg);
UI Expand
titleData Script
Code Block
languagejava
themeMidnight
import java.math.BigDecimal;
  
import com.atlassian.jira.component.ComponentAccessor;
import com.atlassian.jira.issue.Issue;
import com.atlassian.jira.issue.worklog.Worklog;
import com.atlassian.jira.issue.worklog.WorklogManager;
import com.atlassian.jira.jql.parser.JqlParseException;
import com.atlassian.jira.jql.parser.JqlQueryParser;
import com.atlassian.query.Query;
import com.atlassian.jira.util.I18nHelper;
  
import com.decadis.jira.xchart.api.ChartParam;
import com.decadis.jira.xchart.api.model.Period
import com.decadis.jira.xchart.api.util.DateUtils;
  
 
def i18n = ComponentAccessor.getJiraAuthenticationContext().getI18nHelper();
def wlm = ComponentAccessor.getWorklogManager();
def metaCountGroup = chartBuilder.newDataCollector();
  
JqlQueryParser jqlQueryParser = ComponentAccessor.getComponent(JqlQueryParser.class);
Query query = null;
  
Period selectedPeriod = Period.fromString(TimePeriod);
try
{
  query = jqlQueryParser.parseQuery(JQL);
} catch (JqlParseException e)
{
  throw new IllegalArgumentException("Bad JQL: " + JQL);
}
  
for ( Issue issue : chartBuilder.getFilterUtils().performSearch(query, user) )
{
    for ( Worklog wl : wlm.getByIssue(issue) )
    {
      BigDecimal timeSpentAsHours = BigDecimal.valueOf(wl.getTimeSpent()).divide(BigDecimal.valueOf(3600), 4, BigDecimal.ROUND_HALF_UP);
      String author = wl.getAuthorObject() != null ? wl.getAuthorObject().getDisplayName() : "Unknown";
      metaCountGroup.addValue(timeSpentAsHours, author, dateUtils.getPeriodGroup(wl.getCreated(), selectedPeriod));
    }
}
  
metaCountGroup.fillMissingValues();
  
def chartData = chartBuilder.newChartData(i18n.getText("common.concepts.time.spent"));
chartData.setxFormat("%Y.%m.%d");
chartData.setPeriod(selectedPeriod);
chartData.setType(ChartType);
chartData.addCustomData("tooltip", "formatTooltipAsHours");
  
chartBuilder.getChartUtil().transformResult(metaCountGroup, chartData, true);
  
return chartData;

Excerpt Include
DECADIS:Contact support
nopaneltrue