Page History
| Page properties | ||
|---|---|---|
| ||
| UI Text Box | ||||
|---|---|---|---|---|
| ||||
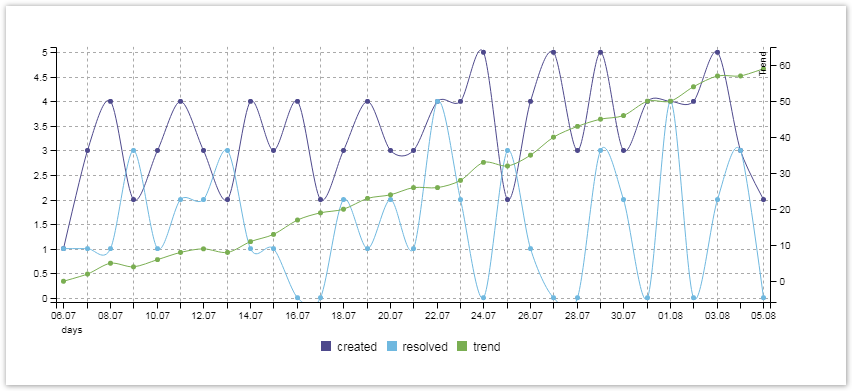
This chart displays issues created within a specific time period, resolved issues in a specific time period and a trend between these issues. The time span and the project can be selected via JQL. |
| Button Hyperlink | ||||||||
|---|---|---|---|---|---|---|---|---|
|
Chart preview
Parameters
| Name | Type | Default |
|---|---|---|
| JQL_CREATED | JQL Autocomplete | |
| JQL_RESOLVED | JQL Autocomplete | |
| TimePeriod | Time period Picker | DAY |
| ChartType | Chart Type Picker | spline |
| Display Created vs. Resolved | BOOLEAN | true |
| Display Trend | BOOLEAN | true |
| UI Expand | |||||||||||
|---|---|---|---|---|---|---|---|---|---|---|---|
| |||||||||||
|
| UI Expand | |||||||||||
|---|---|---|---|---|---|---|---|---|---|---|---|
| |||||||||||
|
| UI Text Box | ||
|---|---|---|
| ||
If you would like to display the date on the x-axis in MM/DD format, you need to adjust the function formatWeek in the layout script. |
| UI Expand | |||||||||||
|---|---|---|---|---|---|---|---|---|---|---|---|
| |||||||||||
|
 Related examples
| Page properties report | ||
|---|---|---|
|
| Excerpt Include | ||||||
|---|---|---|---|---|---|---|
|