Versions Compared

Key

  • This line was added.
  • This line was removed.
  • Formatting was changed.


Page properties
hiddentrue


UI Text Box
sizemedium
typeinfo

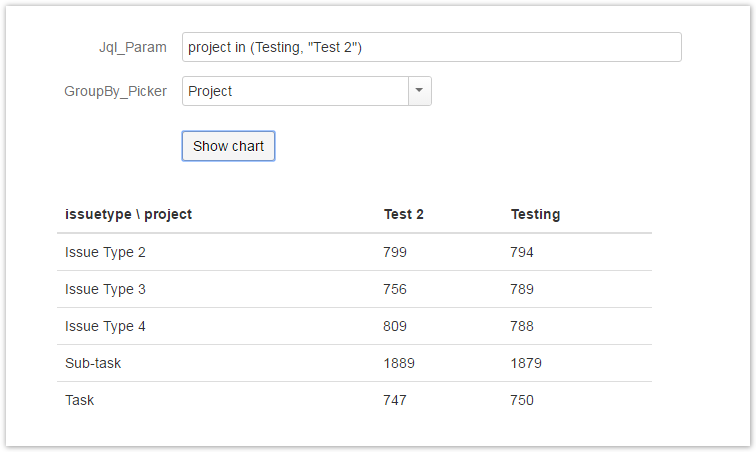
Here we show an example of creating a report for seeing the count of issues in every project, grouped by issue type.

 It is important to mention that the project and issue type grouping can be easily changed by introducing parameters.


What the report generates can be seen in the following image (without the axes, which were added only for better understanding):

  • on the horizontal axis (X), the groups are the projects
  • on the vertical axis (Y), the groups are the count of issues with a certain issue type

Button Hyperlink
iconapprove
titleDownload Scripted Chart Bundle
typeprimary
urlhttps://apps.decadis.net/download/attachments/1807520/Report%20-%20Lucene%20Group%20By.json?api=v2

Chart preview

Parameters

ParameterTypeDefault value
Jql_ParamJQL autocomplete
GroupBy_PickerGroup By PickerProject


UI Expand
titleLayout Script


UI Text Box
typenote

Used layout: Default Table.


Code Block
languagejs
themeMidnight
linenumberstrue
var div = $("#chart");
var table = d3.select(div.parent().get(0)).append('table')
var thead = table.append('thead')
var tbody = table.append('tbody');
 
$("#chart ~ table").addClass("table")
thead.append('tr').selectAll('th').data(chartData.columns[1]).enter().append('th')
                  .text(function(column) { return column; });
$('thead > tr > th:first').text(chartData.ytype + " \\ " + chartData.xtype)
 
var tr = tbody.selectAll('tr').data(chartData.groups[0]).enter().append("tr");
 
var td = tr.selectAll("td").data(function(d) {
    var result = new Array();
    $.each(chartData.columns, function(index, value) {
        if (value[0] == d) {
            result.push.apply(result, value);
        }
    });
    return result;
}).enter().append("td").text(function(d, i) {
    return d;
});


UI Expand
titleData Script


Code Block
languagejs
themeMidnight
linenumberstrue
import java.lang.reflect.Field;
import java.math.BigDecimal;
import java.text.DateFormat;
  
import org.apache.lucene.document.Document;
  
import com.atlassian.jira.component.ComponentAccessor;
import com.atlassian.jira.issue.DocumentIssueImpl;
import com.atlassian.jira.issue.Issue;
import com.atlassian.jira.jql.parser.JqlQueryParser;
import com.atlassian.jira.user.ApplicationUser;
import com.atlassian.query.Query;
  
import com.decadis.jira.xchart.api.model.Period;
import com.decadis.jira.xchart.api.util.DateUtils;
import com.decadis.jira.xchart.api.model.ChartData;
  
DateFormat dateFormat = DateUtils.SimpleDateFormat;
   
JqlQueryParser jqlQueryParser = ComponentAccessor.getComponent(JqlQueryParser.class);
Query query = jqlQueryParser.parseQuery(Jql_Param); //this is the parameter we created
    
Period selectedPeriod = Period.MONTH;
def countGroup = chartBuilder.newDataCollector();
  
def groupValueExtractorX = chartBuilder.getGrouper(GroupBy_Picker); //must be a fieldid, so either Group By Picker, or hardcoded fieldid
def groupValueExtractorY = chartBuilder.getGrouper("issuetype"); //can be replaced by a parameter
  
Field documentField;
documentField = DocumentIssueImpl.class.getDeclaredField("document");
documentField.setAccessible(true);
   
for ( Issue issue : chartBuilder.getFilterUtils().performSearch(query, user) )
{
  for ( String groupX : groupValueExtractorX.getGroups((Document) documentField.get(issue)) )
  {
    for ( String groupY : groupValueExtractorY.getGroups((Document) documentField.get(issue)) )
    {
      groupY = (groupY != null) ? groupValueExtractorY.getResolvedValue(groupY, issue) : groupY;
      groupX = (groupX != null) ? groupValueExtractorX.getResolvedValue(groupX, issue) : groupX;
      countGroup.addValue(BigDecimal.ONE, groupY, groupX);
    }
  }
}
   
countGroup.fillMissingValues();
  
ChartData chartData = chartBuilder.newChartData("issuetype");
chartData.setXType("project");
chartData.setType("table");
  
chartBuilder.getChartUtil().transformResult(countGroup, chartData, true);
  
return chartData;


Related examples

Page properties report
cqllabel = "chart_script_example" and space = currentSpace()


Excerpt Include
DECADIS:Contact support
nopaneltrue