Page History
| Page properties | ||
|---|---|---|
| ||
| UI Text Box | ||||
|---|---|---|---|---|
| ||||
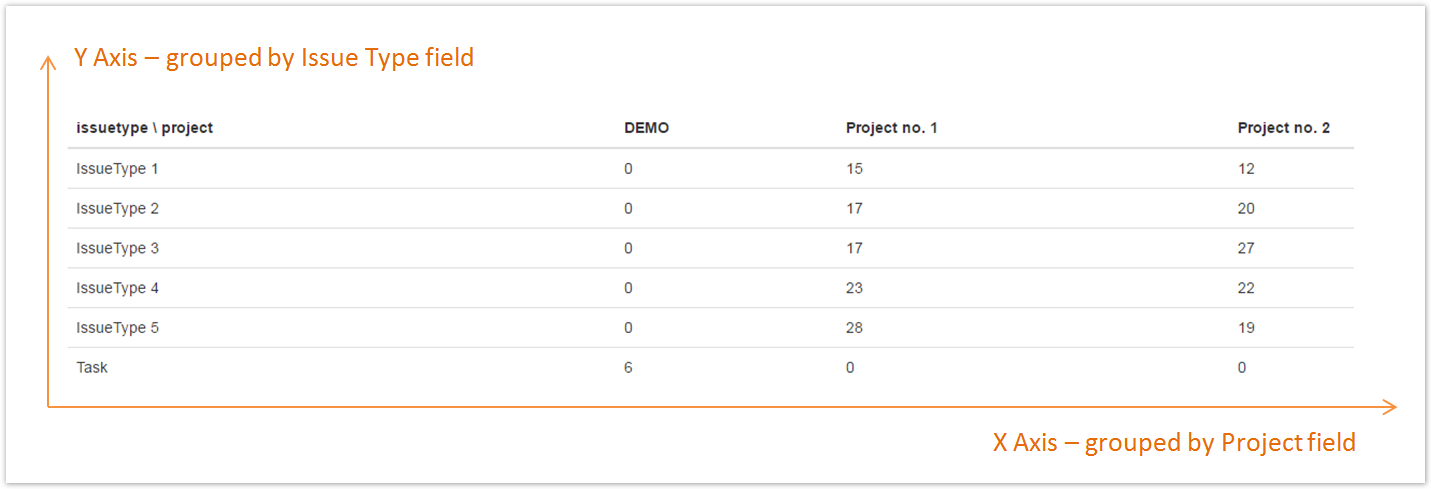
Here we show an example of creating a report for seeing the count of issues in every project, grouped by issue type. |
It is important to mention that the project and issue type grouping can be easily changed by introducing parameters.
What the report generates can be seen in the following image (without the axes, which were added only for better understanding):
- on the horizontal axis (X), the groups are the projects
- on the vertical axis (Y), the groups are the count of issues with a certain issue type
| Button Hyperlink | ||||||||
|---|---|---|---|---|---|---|---|---|
|
Chart preview
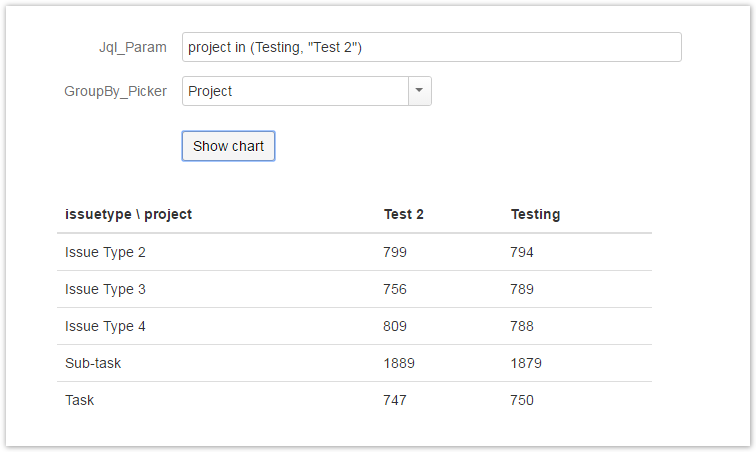
Parameters
| Parameter | Type | Default value |
|---|---|---|
| Jql_Param | JQL autocomplete | |
| GroupBy_Picker | Group By Picker | Project |
| UI Expand | ||||||||||||||
|---|---|---|---|---|---|---|---|---|---|---|---|---|---|---|
| ||||||||||||||
|
| UI Expand | |||||||||
|---|---|---|---|---|---|---|---|---|---|
| |||||||||
|
 Related examples
| Page properties report | ||
|---|---|---|
|
| Excerpt Include | ||||||
|---|---|---|---|---|---|---|
|