As the leader of a development team, it is a daily responsibility to ensure that work is distributed effectively. Our Two Dimensional Filter Statistics gadget helps you keep track of it. In this example, you will learn how to use sumUp to get a weekly overview for each assignee.
VERSION 3.8.0 is required!
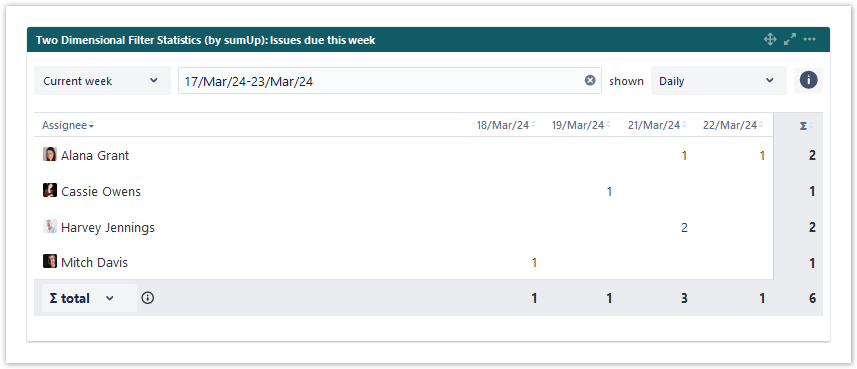
As you can see, we have configured the gadget to display the issues due this week per assignee. The total number of issues for each individual is displayed at the end of each row. Additionally, the number of issues due on each day is shown at the bottom of the column. Finally, the total number of issues is displayed in the top right corner. The options to select a different time period are located at the top.
You can tweak the date options on top of the gadget at any time without breaking your configurations.
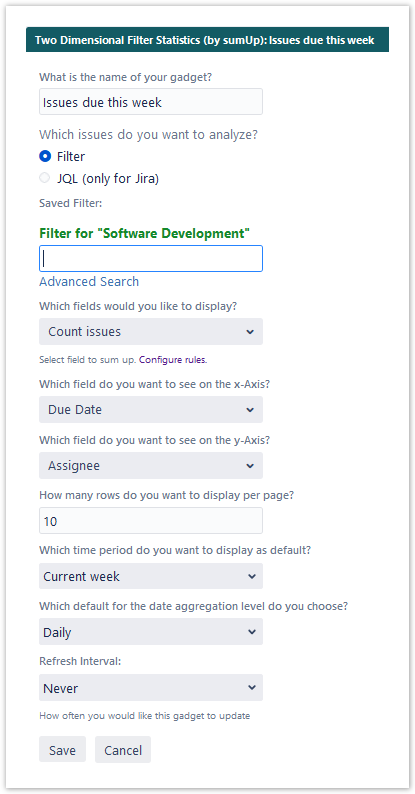
Configuration
| Option | Settings |
|---|---|
| What is the name of your gadget? | A precise name makes it easy to locate the gadget on the dashboard. |
| Which issues do you want to analyze? | Before "Filter" can be chosen, there has to be set a Filter for the project. |
| Which fields would you like to display? | To view all tickets per assignee, select "Count issues". |
| Which field do you want to see on the x-Axis? | To group the data select "Due Date" |
| Which field do you want to see on the y-Axis? | To display the number of issues per colleague select the "Assignee" |
| How many rows do you want to display per page? | If there are ten or fewer colleagues, the default is a good choice. |
| Which time period do you want to display as default? | For a weekly overview select "Current week". |
| Which default for the date aggregation level do you choose? | To view each day separately, select "Daily". |
| Refresh Interval: | The gadget will refresh automatically when the side is reloaded, if you choose "Never". |