The Two Dimensional Filter Statistics Gadget works like the built-in Two Dimensional Filter Statistics gadget for Jira extended by a total column as well as a total row for a numeric custom field.

 Configuration
Select a field that will be used to group the results by on the X-axis.

Select a field that will be used to group the results by on the Y-axis.

 View mode
SINCE VERSION 3.8.0
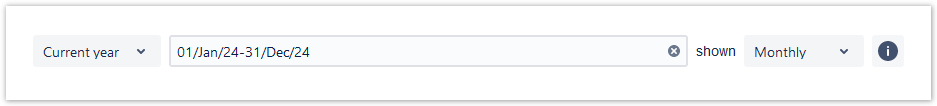
The gadget displays an additional filter at the top when a date field is selected in the configuration.
Initially, it is pre-populated with the value set in the configuration and the data is displayed accordingly.
It contains the following options:
| Option | Description |
|---|---|
| Time Period | The drop-down menu contains the options in the following order:
|
| Date picker | The picker allows you to override the Time Period selection. You can select the start and end dates of the aggregated data by clicking first on the start date and then on the end date.
To enter your chosen date, click next to the expanded calendar. If the date range is not customized, it reflects the chosen Time period. For example, the period selection would display 01/Jan/24-31/Dec/24 if the Current year option is selected. If the date range is adjusted, the Date Filter View changes to Customized. |
| Date grouping | The selector determines how the data is grouped in the columns/rows of the table. The drop-down menu contains the following options:
If the data spans more than one year, the Weekly, Monthly and Quarterly data are shown with the year as suffix, e.g. Q1/24. |
| Info icon | The tooltip displays information about the data displayed in the gadget. |
SINCE VERSION 3.8.0
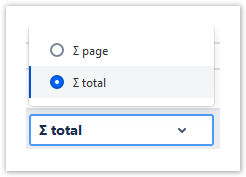
You can choose between the overall ∑ total or the total of the ∑ page. Or you can choose between the Ø total or the Ø page, if you have selected average fields.
 Use cases and examples
| Use case | Description | Gadget |
|---|---|---|
| Issues due this week | Displays how many issues are due for each assignee in the current week. | Two Dimensional Filter Statistics |
If you still have questions, feel free to refer to our support team.