Use case
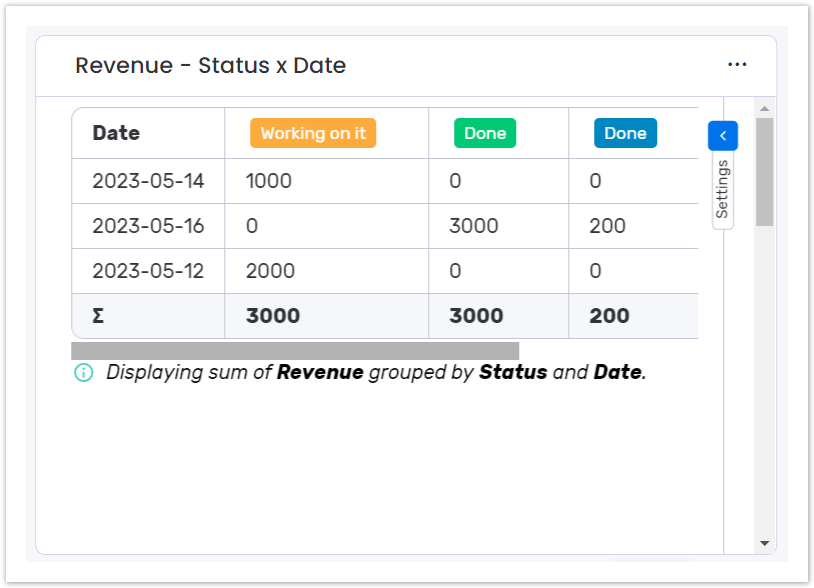
If you want to analyze revenue grouped by date and status, you can quickly configure a Two dimensional widget to show these metrics with sumUp for monday.com.
Work tasks usually aren't only tied to an estimate of work hours spent on them by your team but also to an expected revenue they are worth. With this matrix you can keep track of how the revenue associated with your tasks is related to their date and status.
 Configuration
Select your status column unter How to group items on x-axis?
This groups the revenue by the status of the task along the x-axis of the table.
Select your date column unter How to group items on y-axis?
This groups the revenue by the date of the task along the y-axis of the table.
If you still have questions, feel free to refer to our support team.