Page History
| UI Text Box | ||||
|---|---|---|---|---|
| ||||
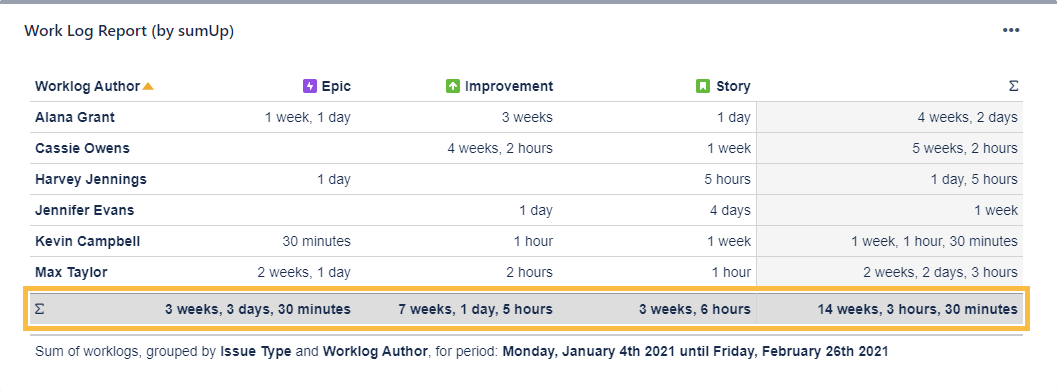
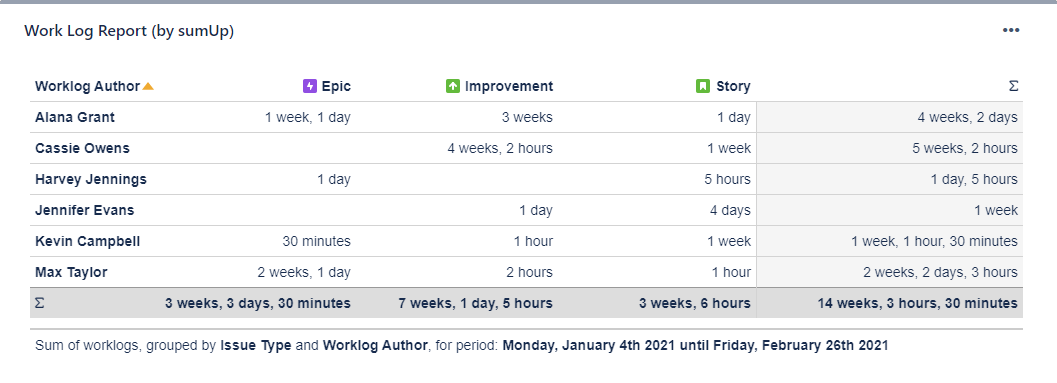
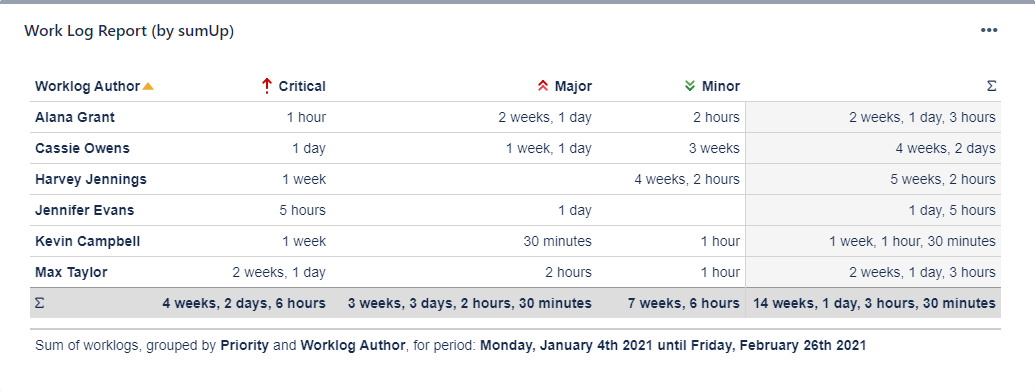
The Work Log Report (by sumUp) is similar to the Two Dimensional Filter Statistics gadget with the difference that it sums up work logs instead of numeric custom fields. |
 Configuration
| UI Expand | ||
|---|---|---|
| ||
Select an existing filter or choose to enter custom JQL. |
| UI Expand | |||||
|---|---|---|---|---|---|
| |||||
|
| UI Expand | ||||||||||||
|---|---|---|---|---|---|---|---|---|---|---|---|---|
| ||||||||||||
Only time logs of the selected period will be displayed. Available options are:
|
| UI Expand | |||||||||||||||||
|---|---|---|---|---|---|---|---|---|---|---|---|---|---|---|---|---|---|
| |||||||||||||||||
Select a field that will be used to group the results by on the X-axis. Examples:
|
| UI Expand | ||
|---|---|---|
| ||
Define how sumUp will process the calculation internally. Choose one of these two options:
|
| UI Expand | ||
|---|---|---|
| ||
Choose how many results you want to display on your dashboard. |
| UI Expand | ||
|---|---|---|
| ||
Check this option to refresh the results of the gadget every 15 minutes. Useful when displaying information on wallboard. |
| UI Text Box | ||
|---|---|---|
| ||
Rendering this gadget can be resource-intensive if there is a large number of work logs. |
...