The Work Log Report (by sumUp) is similar to the Two Dimensional Filter Statistics gadget with the difference that it sums up work logs instead of numeric custom fields.
 Configuration
Select a field that will be used to group the results by on the X-axis.
Examples:
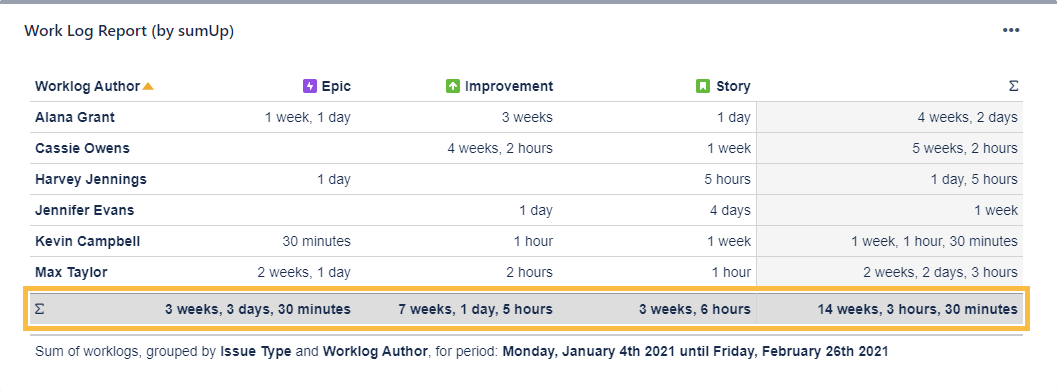
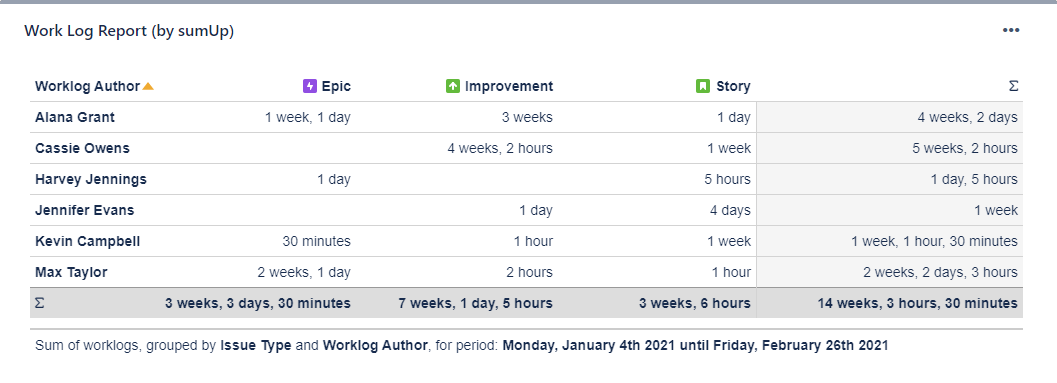
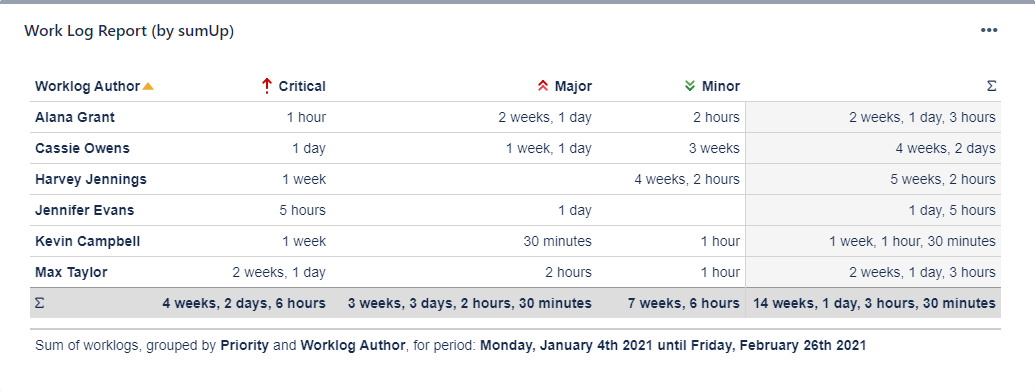
| Work log author and issue type | Worklog author and priority |
|---|---|
|
|
| Option | Description |
|---|---|
| Time period | The drop-down menu contains the options in the following order:
|
| Date picker | The picker allows you to override the Time period selection. You can select the start and end dates of the aggregated data by clicking first on the start date and then on the end date.
To enter your chosen date, click next to the expanded calendar. If the date range is not customized, it reflects the chosen Time period. For example, the period selection would display 01/Jan/24-31/Dec/2024 if the Current year option is selected. If the date range is adjusted, the Date Filter View changes to Customized. |
| Date grouping | The selector determines how the data is grouped in the columns/rows of the table. The drop-down menu contains the following options:
If the data spans more than one year, the Weekly, Monthly and Quarterly data are shown with the year as suffix, e.g. Q1/24. |
| Info icon | The tooltip displays information about the data displayed in the gadget. |

Rendering this gadget can be resource-intensive if there is a large number of work logs.
If you still have questions, feel free to refer to our support team.