sumUp for Jira Cloud can now be used within the Issue navigator as a BETA feature to display sums.
Recently, sumUp for Jira Cloud got extended beyond the creation of dashboard gadgets. It is now possible to generate and view key metrics directly in the issue navigator as well. This feature is matching a similar functionality which so far has been only available in sumUp for Jira Data Center. The new beta feature makes it easy to view key metrics based on JQL queries or filters in the issue navigator.
Location
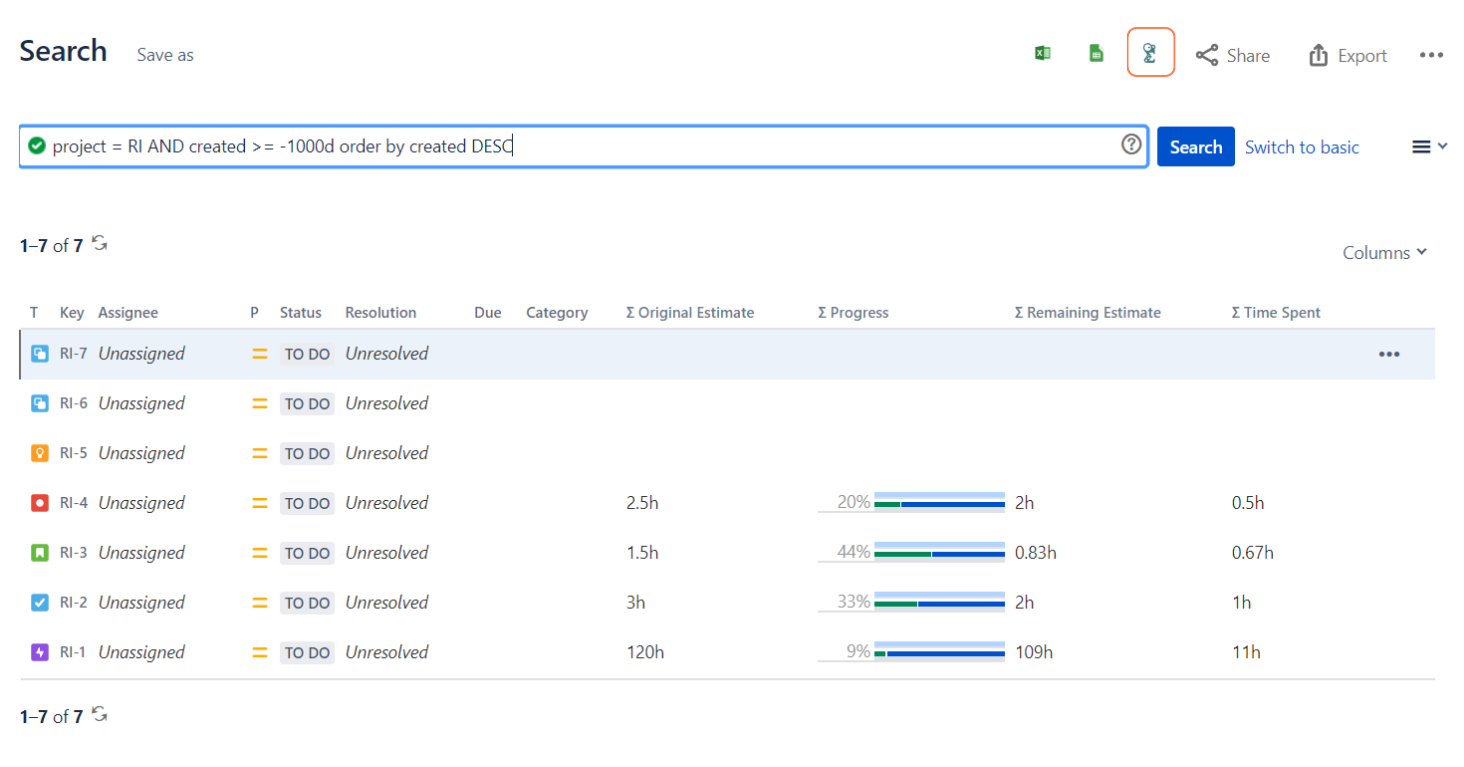
To use the feature, you need to navigate to the Issue navigator and execute a query to search for a specific set of issues. You can access sumUp within the issue navigator by clicking on the sumUp icon in the bar above the search window.
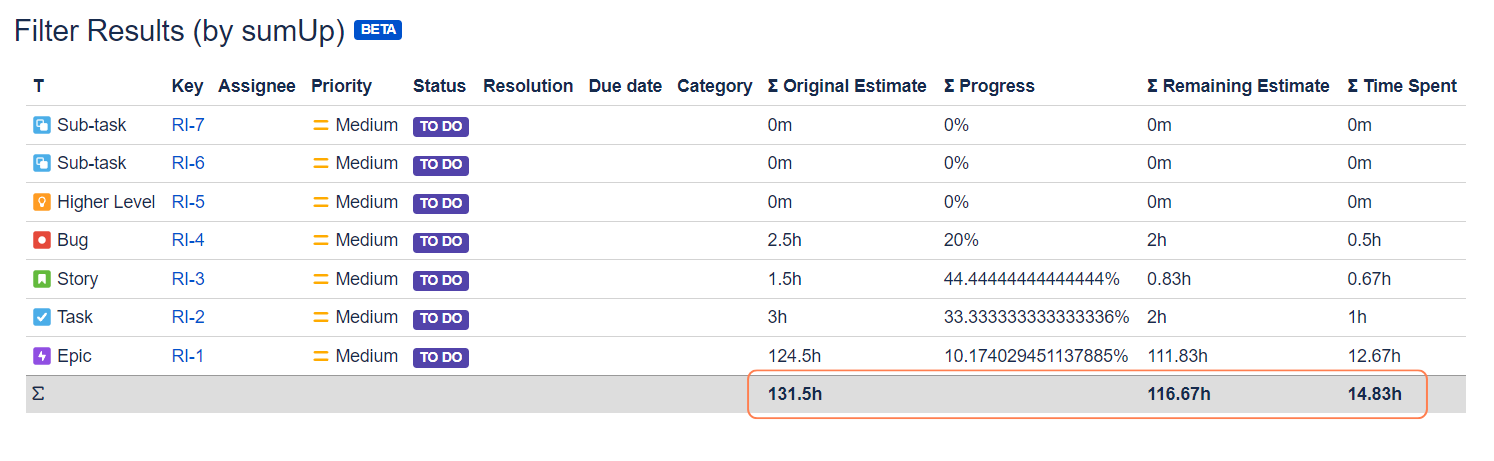
After clicking on the icon, a Filter Results (by sumUp) gadget opens in a popup and shows the data that was selected in the originating issue navigator search or JQL query. In addition, the gadget displays a calculation row at the bottom with the sum of the values of the selected columns.
Use Cases and examples
While the sumUp dashboard gadgets are useful to monitor key metrics over a longer timeframe or even on a permanent base, the sumUp extension for the Jira Issue navigator lets you perform quick calculations during your searches. This helps you with swiftly answering questions or gaining further insights about your projects based on a search query.
Planning project times.
When planning projects in Jira it is often essential to consider the overall timeframe of the project. A common application is to compare the original estimate of the project timeframe with the actual working hours team members spent so far on their issues. With the sumUp functionality in the Issue navigator it is possible to calculate the summed up time estimates and working hours for any set of issues, such as for a specific project or a specific type of issue like bugs.
Viewing project key metrics.
By utilizing custom fields for Jira issues it is possible to summarize key metrics about a project directly in the Issue navigator. The sumUp functionality extends this feature by providing a quick way to view summed up values of selected columns. Any specific metrics which got declared for a project can get easily summed up and compared in the Filter Results gadget.
Configuration
Configuring and using the sumUp for Jira Cloud gadget in the Issue navigator is easy.
Open the Issue navigator in Jira Cloud.

Configure a search filter or execute a JQL query in the Issue navigator.
With a search filter you can manually choose which issues you want to include in your query based on their fields.
The search filter provides a GUI (Graphical User Interface) making it easier and more intuitive to declare the search query.
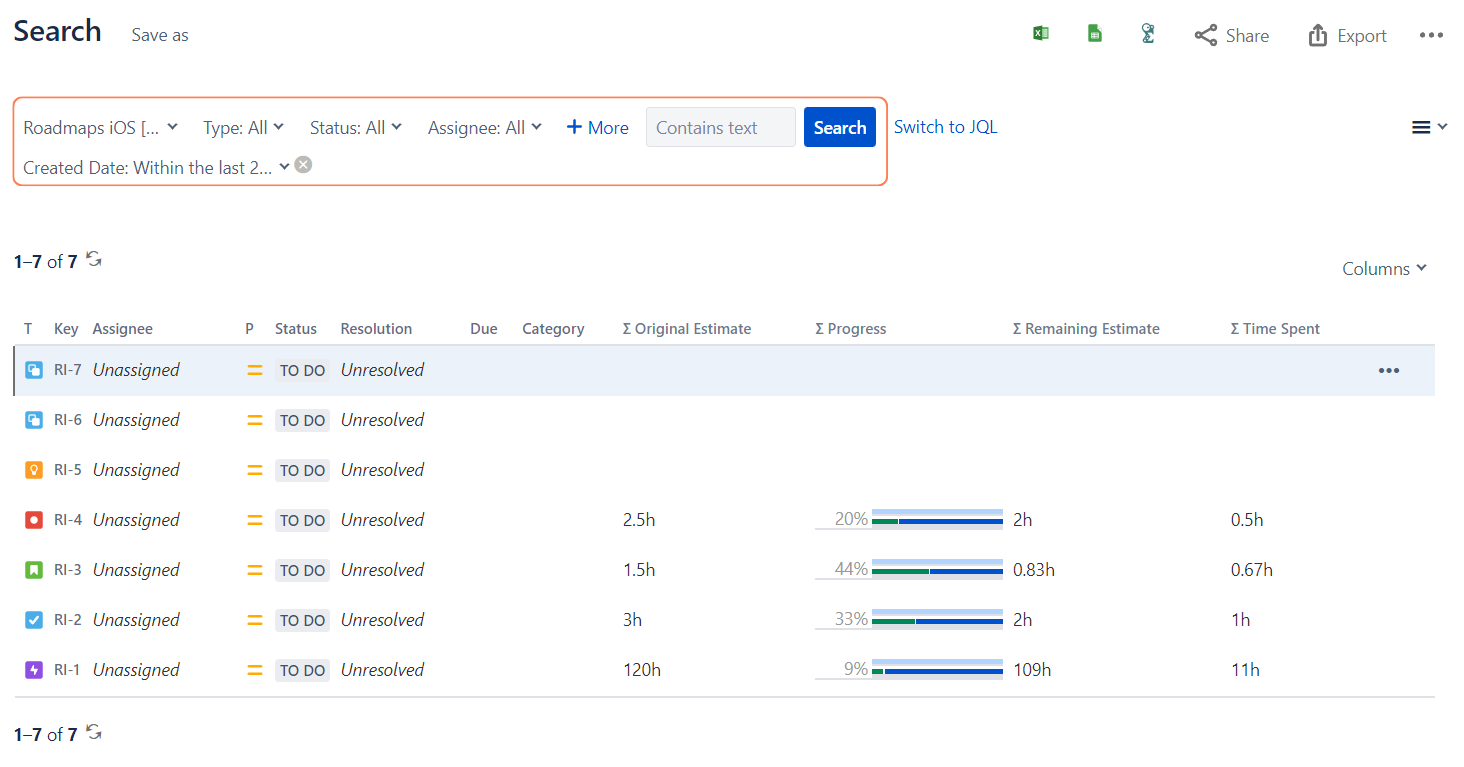
JQL requires you to declare the search term using a programming language-like syntax and abstract logic.
Using JQL can be more difficult, but it is a more powerful tool to execute complex queries at higher performance.
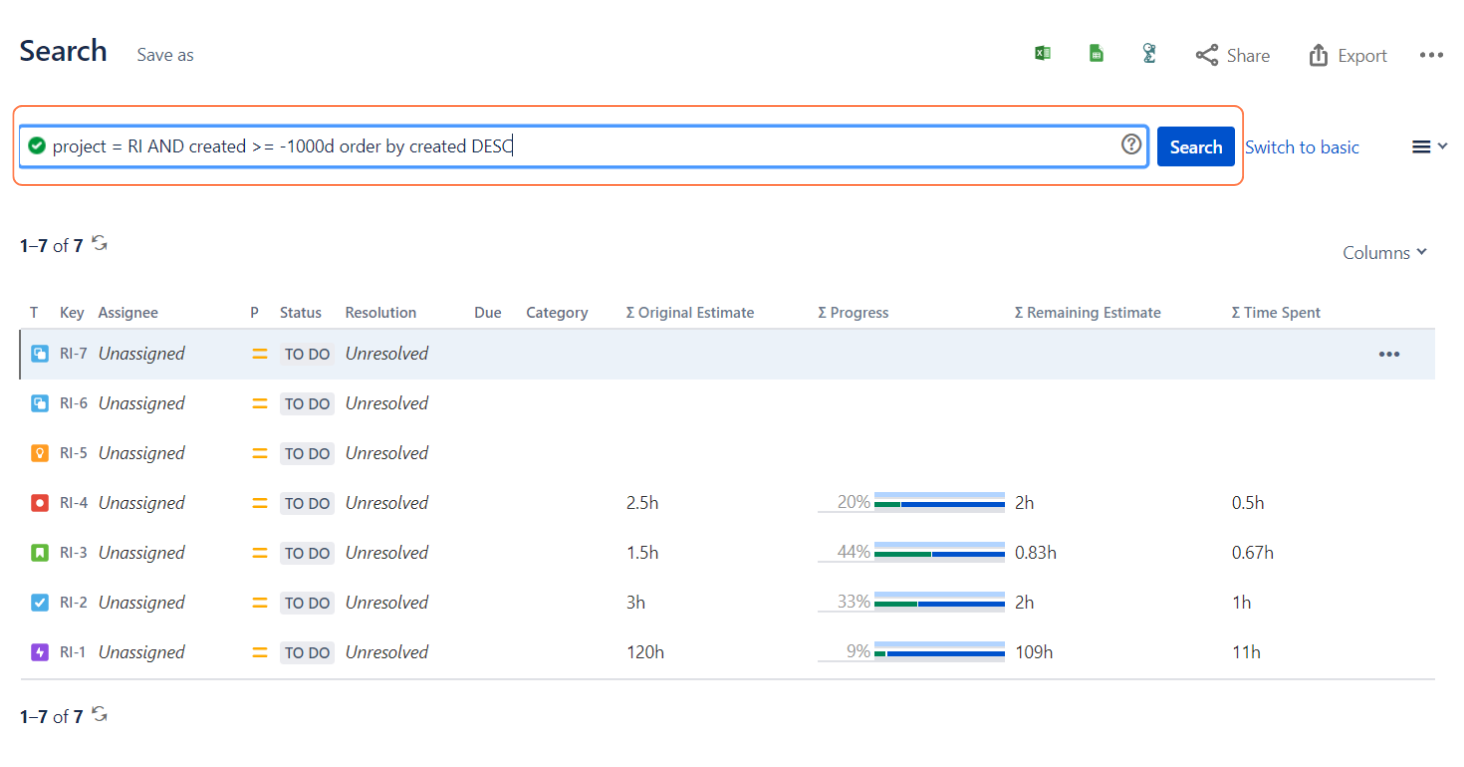
After executing the search query, you can open the Filter Results (by sumUp) gadget by clicking on the sumUp icon above the search bar.
The gadget will appear in a pop-up window. You can see the calculated sums of the selected numerical columns in a calculation row at the bottom of the table.
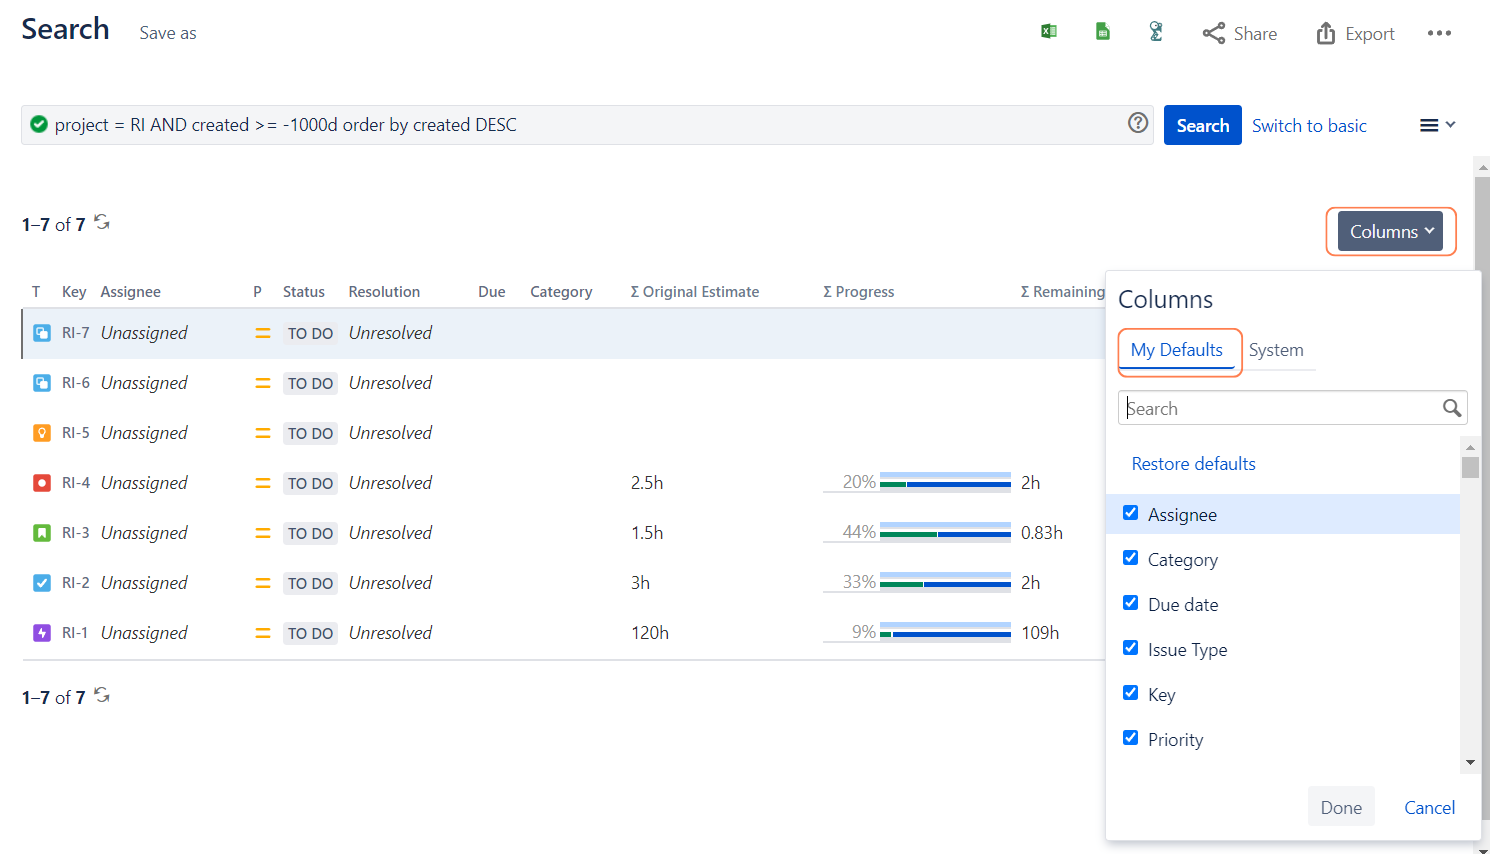
You can configure which columns get included in the calculation under "My Defaults" in the Issue navigator by clicking on the "Columns" button.
If you still have questions, feel free to refer to our support team.