Page History
| UI Text Box | ||||
|---|---|---|---|---|
| ||||
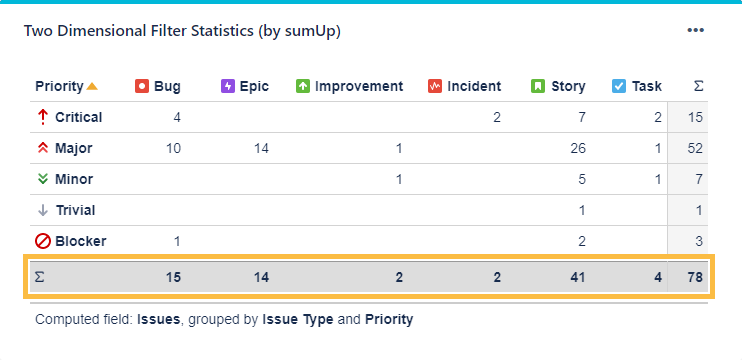
The The Two Dimensional Filter Statistics (by sumUp) works like the like the built-in Two Dimensional Filter Statistics gadget for Jira .In addition, it can also calculate the sum for one numeric extended by a total column as well as a total row for a numeric custom field. |

 Configuration
| ui-text-boxexpand | ||
|---|---|---|
| ||
In this documentation, you will notice the symbol ( * ) next to some parameters, it means that this field is mandatory and shall not be left empty. Fields without the symbol are optional. |
Filter*
| Info | ||
|---|---|---|
| ||
Select an existing filter or choose to enter custom JQL. |
JQL
| |||||||
Select whether you want to use a predefined JQL Filter or a custom JQL to get the issues.
| tip
|
X-axis*
|
| UI Expand | |||||
|---|---|---|---|---|---|
| |||||
Select the field that you want to calculate a sum for.
|
| UI Expand | ||
|---|---|---|
| ||
| Info | ||
| ||
Select a field that will be used to group the results by on the Xx-axisAxis. |
Y-axis*
|

| UI Expand | ||
|---|---|---|
| ||
| Info | ||
| ||
Select a field that will be used to group the results by on the Yy-axis. |
Field to sum up*
Axis.
|

| UI Expand | ||
|---|---|---|
| ||
Choose how many results you want to display on your dashboard. |
Additional options
| UI Text Box | ||||
|---|---|---|---|---|
| ||||
Configure your sumUp gadget with date-related settings such as the default time period and the default date aggregation level. Additional options include a 15-minute data refresh, grouping results by name, and adding links to the Issue Navigator. |
| UI Expand | |||||
|---|---|---|---|---|---|
| |||||
Check this option to refresh the results of the gadget every 15 minutes.
|
| UI Expand | ||||||
|---|---|---|---|---|---|---|
| ||||||
This option is helpful if you wish to group the results by fields that share the same name or the options. For example, if you have a fix version named "EAP_Q2" across multiple projects, checking this option will ensure the results will be grouped under the same name instead of showing them as separate entries | ||||||
| Info | ||||||
| ||||||
Select the field that you want to calculate a sum for.
|
| UI Expand | |||||||||||
|---|---|---|---|---|---|---|---|---|---|---|---|
| |||||||||||
If you are someone who likes seeing the issues behind numeric entries on the gadget, this option is your match. With this option checked, you are taken to the Issue navigator page every time you click on a numeric entry on the sumUp gadget. Once you are on the Issue navigator page, you can see the JQL (and subsequently the issues) that accounts for the numeric entry displayed on gadget.
|
| UI Expand | ||
|---|---|---|
| ||
If you have chosen to group the data by a date or date time field (e.g. Due date or Created), you can set a default time period for the displayed data when the gadget is loaded or refreshed. You can choose between:
|
| UI Expand | ||
|---|---|---|
| ||
If you have chosen to group the data by a date or date time field (e.g. Due date or Created), you can set a default aggregation level for the displayed data when the gadget is loaded or refreshed. You can choose between:
|
 View mode
| UI Expand | |||||
|---|---|---|---|---|---|
| |||||
|
| UI Expand | ||||||||||||||||||||||||||||||||||
|---|---|---|---|---|---|---|---|---|---|---|---|---|---|---|---|---|---|---|---|---|---|---|---|---|---|---|---|---|---|---|---|---|---|---|
| ||||||||||||||||||||||||||||||||||
It contains the following options:
|

 Use cases and examples
| Page properties report | ||||||
|---|---|---|---|---|---|---|
|
| Excerpt Include | ||||||
|---|---|---|---|---|---|---|
|
Number of results
| Info | ||
|---|---|---|
| ||
Choose how many results you want to display on your dashboard. |
Auto refresh
| Info | ||
|---|---|---|
| ||
Check this option to get an update automatically every 15 minutes to be displayed on your dashboard. |