Page History
| Page properties | ||
|---|---|---|
| ||
| UI Text Box | ||||
|---|---|---|---|---|
| ||||
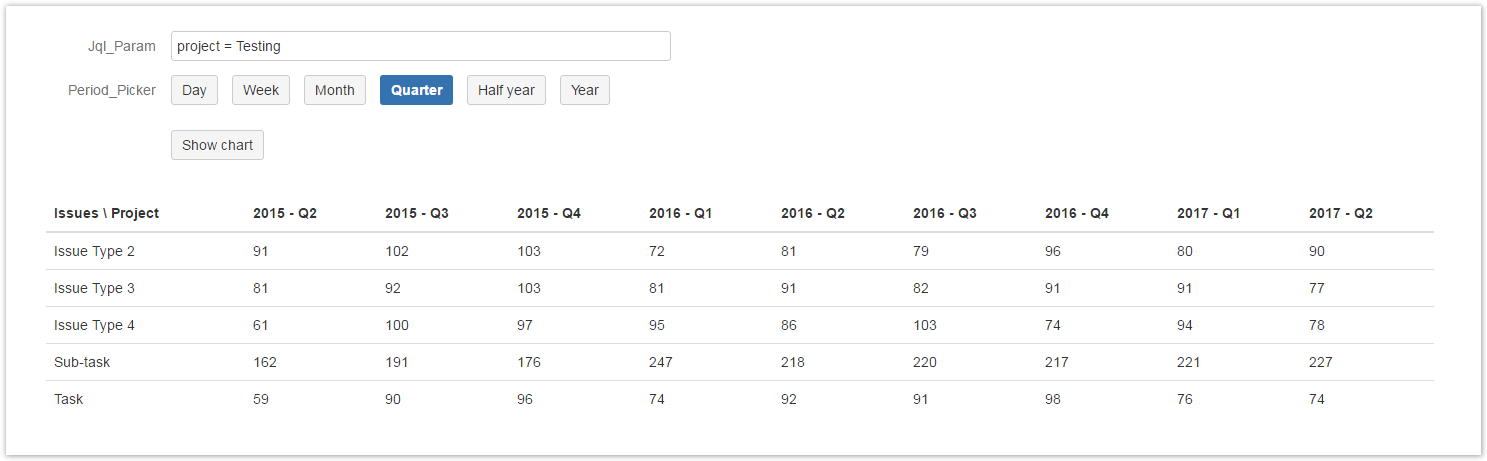
In this example, we display the number of created issues grouped by Issue Type on the X-Axis, and by Period on Y-axis. |
The report looks like this, where both the Jql_Param and Period_Picker are dynamically populated.
| Button Hyperlink | ||||||||
|---|---|---|---|---|---|---|---|---|
|
Chart preview
The period is a helper xCharts class, that handles time periods and can be found in the API Documentation.
but the Period can be also dynamically set, by using a parameter:
| Code Block |
|---|
Period selectedPeriod = Period.fromString(Period_Picker); |
If Period_Picker is a TEXT Parameter, it has to have one of the following values:
- Day
- Week
- Month
- Quarter
- Half a year
- Year
An alternative way is to use the "Time Period Picker".
Parameters
| Name | Type | Default value |
|---|---|---|
| Jql_Param | JQL Autocomplete | |
| Period_Picker | Time Period Picker | Month |
| UI Expand | ||||||||||||||
|---|---|---|---|---|---|---|---|---|---|---|---|---|---|---|
| ||||||||||||||
|
| UI Expand | |||||||||
|---|---|---|---|---|---|---|---|---|---|
| |||||||||
|
| UI Expand | |||||||||
|---|---|---|---|---|---|---|---|---|---|
| |||||||||
|
 Related examples
| Page properties report | ||
|---|---|---|
|
| Excerpt Include | ||||||
|---|---|---|---|---|---|---|
|