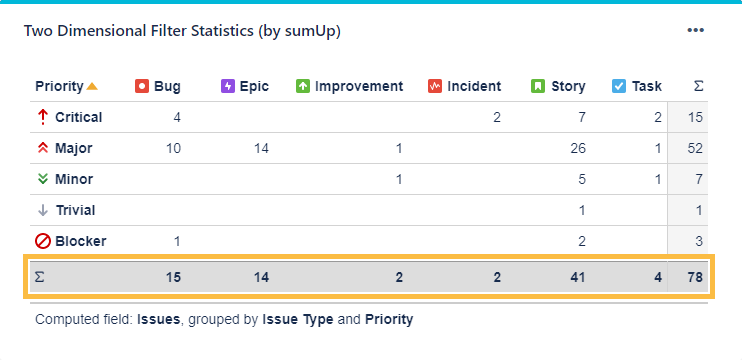
The Two Dimensional Filter Statistics (by sumUp) works like the built-in Two Dimensional Filter Statistics gadget for Jira extended by a total column as well as a total row for a numeric custom field.
 Configuration
![]() Only available if Custom JQL was selected in the Filter parameter.
Only available if Custom JQL was selected in the Filter parameter.
No need to create hundreds of filters to be used in various gadgets - simply define the result set by adding custom JQL!
Select a field that will be used to group the results by on the X-axis.
| Option | Description |
|---|---|
| Time period | The drop-down menu contains the options in the following order:
|
| Date picker | The picker allows you to override the Time period selection. You can select the start and end dates of the aggregated data by clicking first on the start date and then on the end date.
To enter your chosen date, click next to the expanded calendar. If the date range is not customized, it reflects the chosen Time period. For example, the period selection would display 01/Jan/24-31/Dec/2024 if the Current year option is selected. If the date range is adjusted, the Date Filter View changes to Customized. |
| Date grouping | The selector determines how the data is grouped in the columns/rows of the table. The drop-down menu contains the following options:
If the data spans more than one year, the Weekly, Monthly and Quarterly data are shown with the year as suffix, e.g. Q1/24. |
| Info icon | The tooltip displays information about the data displayed in the gadget. |

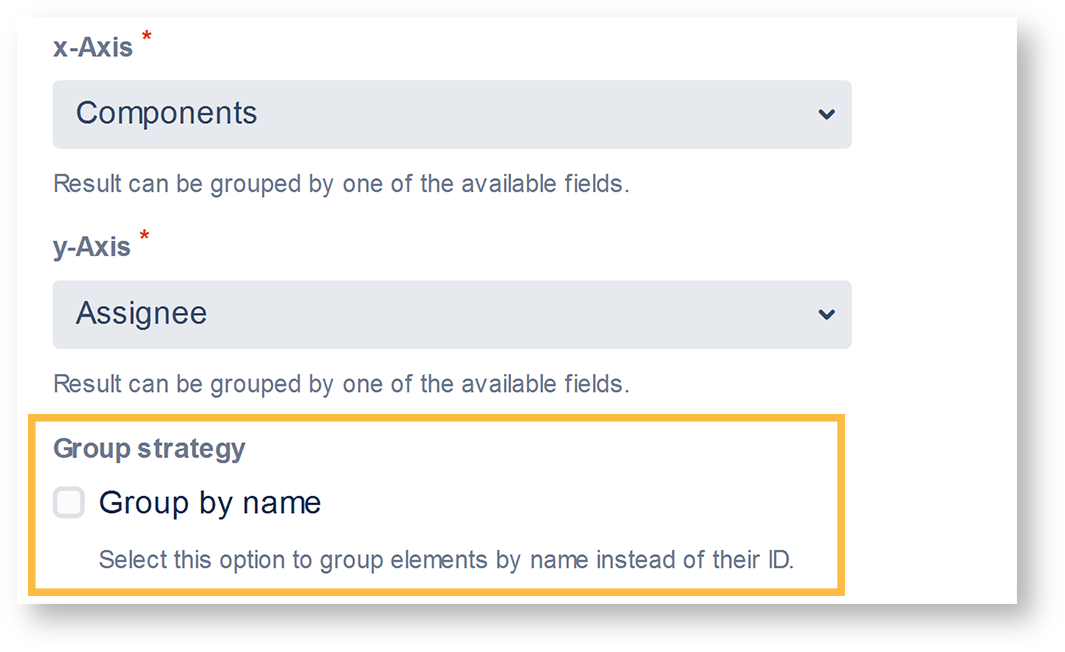
Select a field that will be used to group the results by on the Y-axis.
| Option | Description |
|---|---|
| Time period | The drop-down menu contains the options in the following order:
|
| Date picker | The picker allows you to override the Time period selection. You can select the start and end dates of the aggregated data by clicking first on the start date and then on the end date.
To enter your chosen date, click next to the expanded calendar. If the date range is not customized, it reflects the chosen Time period. For example, the period selection would display 01/Jan/24-31/Dec/2024 if the Current year option is selected. If the date range is adjusted, the Date Filter View changes to Customized. |
| Date grouping | The selector determines how the data is grouped in the columns/rows of the table. The drop-down menu contains the following options:
If the data spans more than one year, the Weekly, Monthly and Quarterly data are shown with the year as suffix, e.g. Q1/24. |
| Info icon | The tooltip displays information about the data displayed in the gadget. |