xCharts gadgets can be used for displaying created charts directly on your dashboard with no need for heading over to the xCharts configuration.
Currently, there are two gadgets available within xCharts:
- xCharts gadget: Displays charts with no further configuration on the dashboard.
- xChart gadget+: When enabled, charts can be directly configured on the dashboard via live configuration parameters.
A glance at the gadgets:
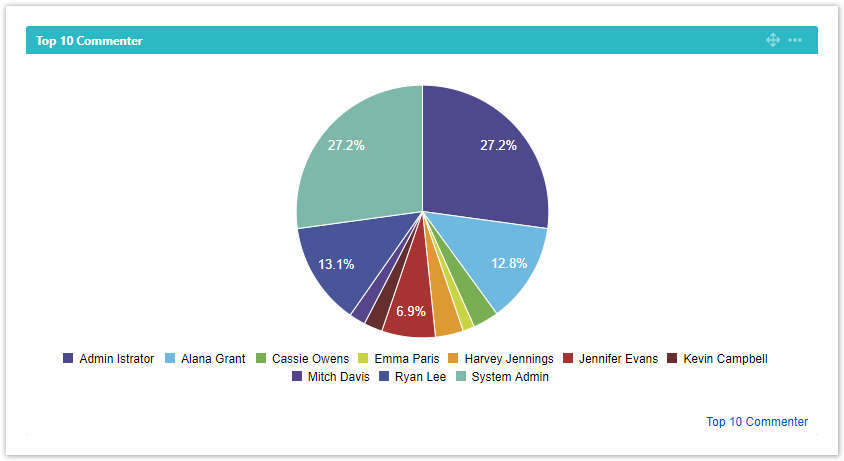
xChart gadget
The xCharts gadget ← (link) displays the charts and reports with the possibility to set a refresh interval and change the background color:
xCharts gadget+
SINCE VERSION 1.7.0, the xCharts gadget+ ← (link) can be adapted right on the dashboard using live configuration parameters:
Currently, only the xCharts gadget can be used within Confluence.
If you still have questions, feel free to refer to our support team.