To simplify the development of new scripted charts, we provide the code for all built-in charts and layouts. The aim is for developers to be able to create their own scripted charts based on the examples provided by us.
| Chart | Chart preview | Description | Parameters |
|---|---|---|---|
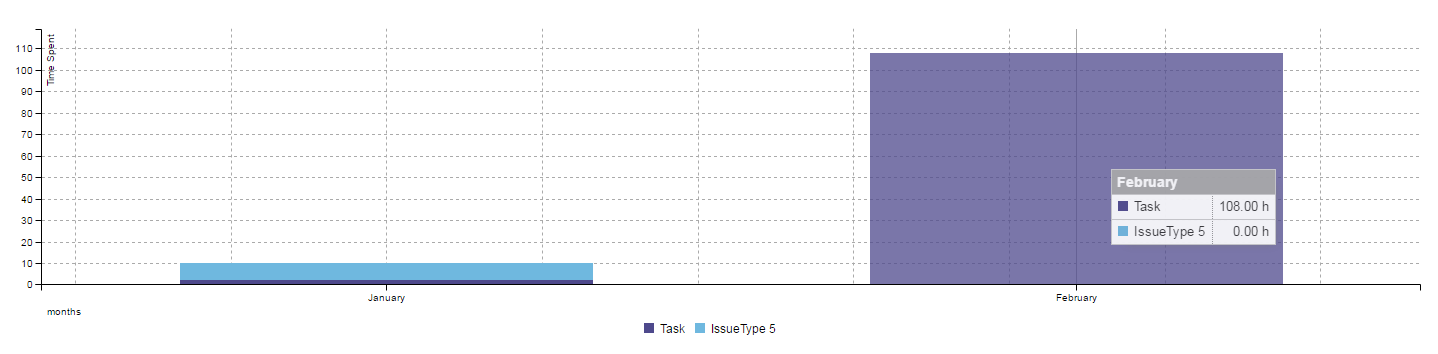
| Worklog chart (Grouped by issue attribute) |
| Shows the amount of logged work. |
|
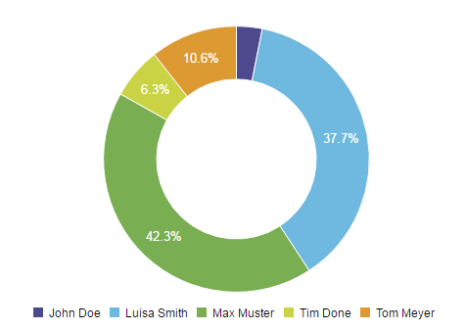
| Who's working by JQL |
| Shows the distribution of working times on a specific issue based on the work log. |
|
| Who's working |
| Shows the amount of working times. Filter by using JQL and group by time unit. |
|
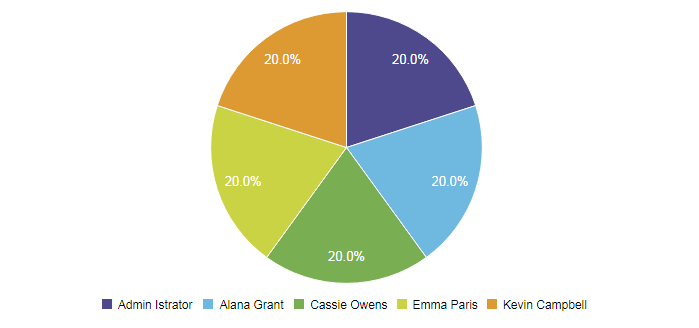
| Who's commenting |
| Shows the distribution of comments on a specific issue. |
|
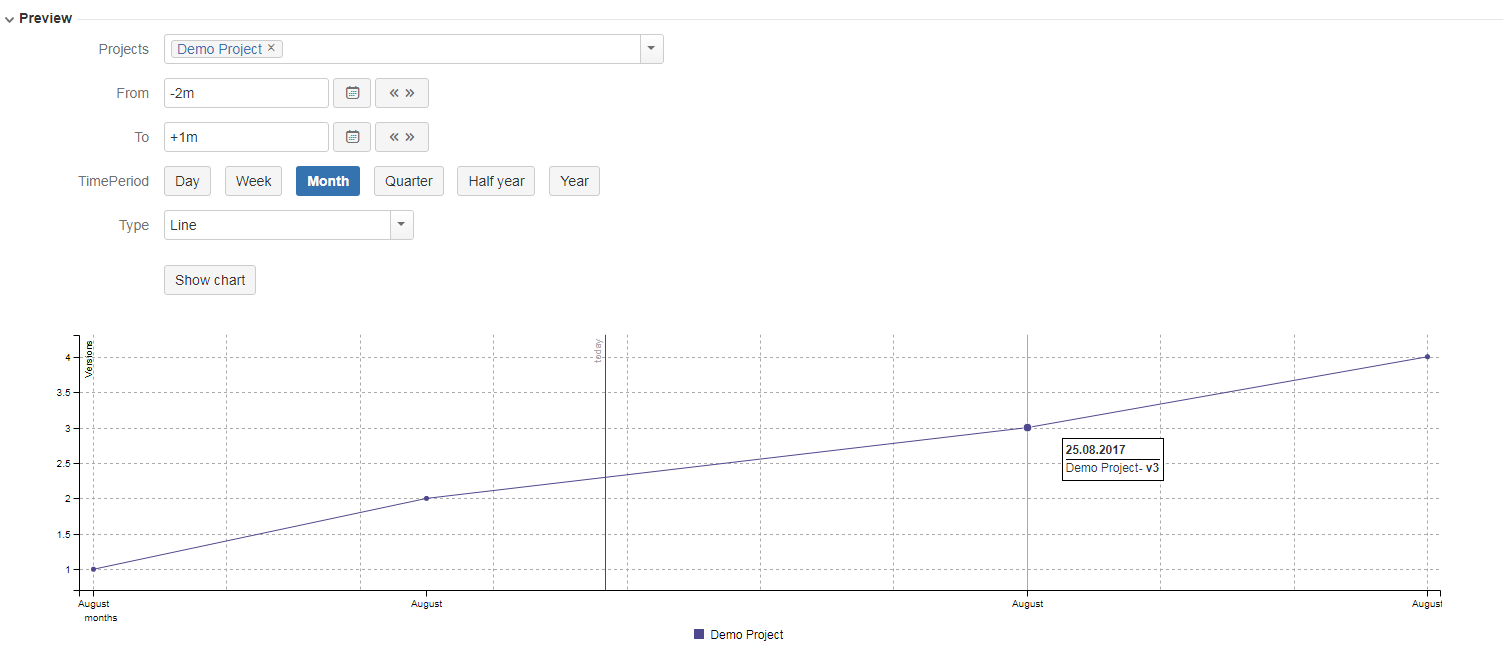
| Versions release dates |
| Shows release dates for versions in the selected projects over time. |
|
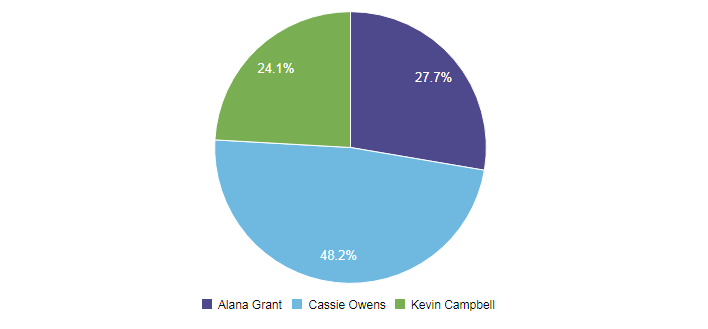
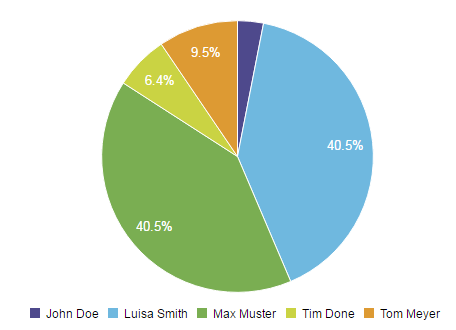
| Unresolved tickets by assignee |
| Shows the percentage of unresolved tickets per assignee, in a selected project, as a pie chart. |
|
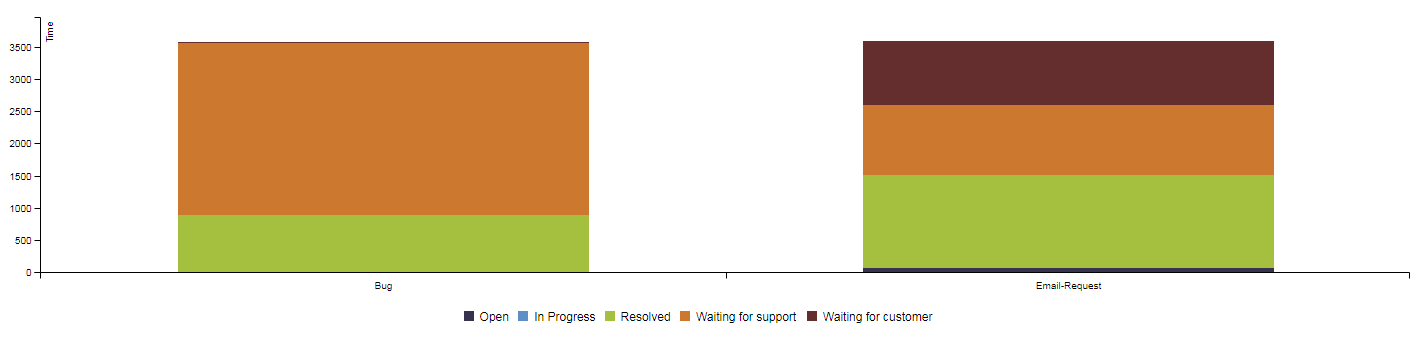
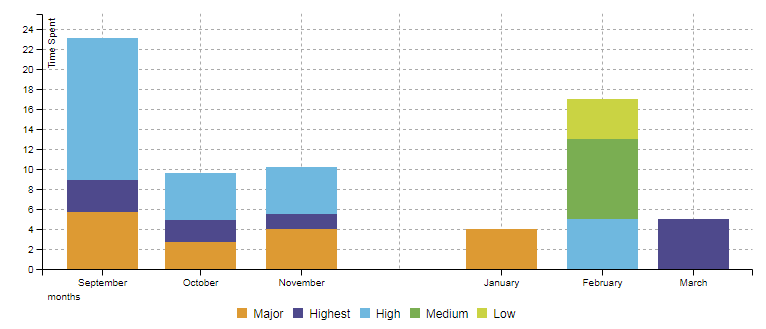
| Time in status (By issue attribute) |
| See how long issues were in a certain status. Additional grouping on the Y axis (Group By) |
|
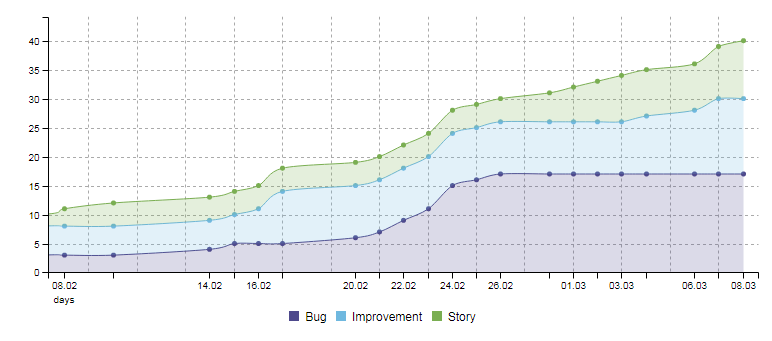
| Time frame chart |
| Highly configurable issue chart, which shows amount of issues over time, grouped by a specific date field. |
|
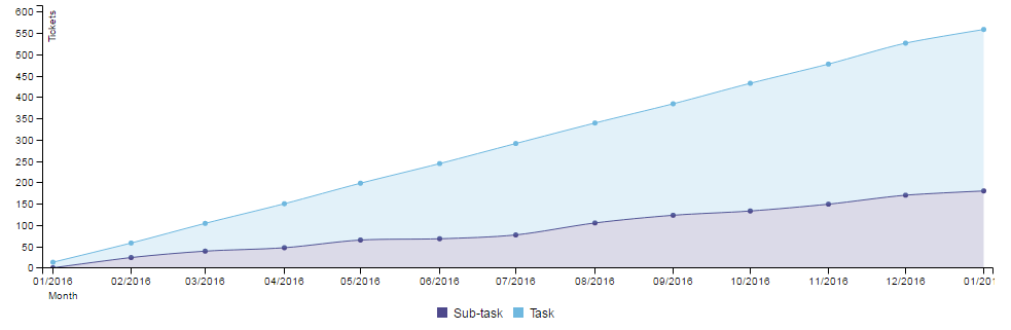
| Tickets over time |
| Shows the amount of issues over time within a specific project. |
|
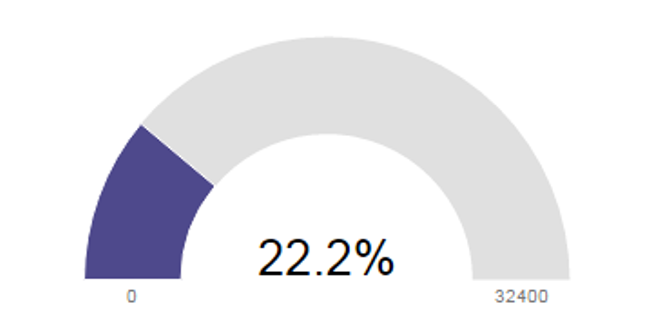
| Progress by project |
| Shows the overall progress of a specific project. Time estimated vs. time logged. |
|
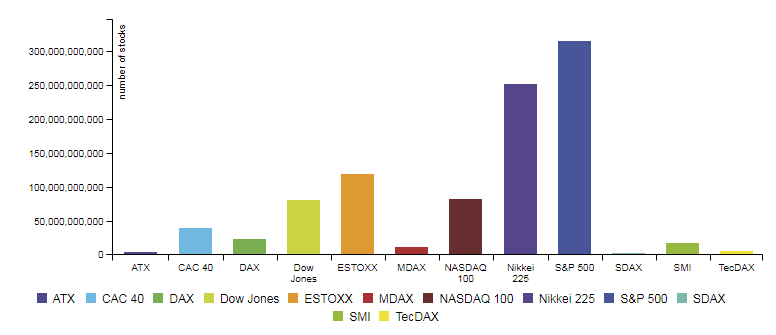
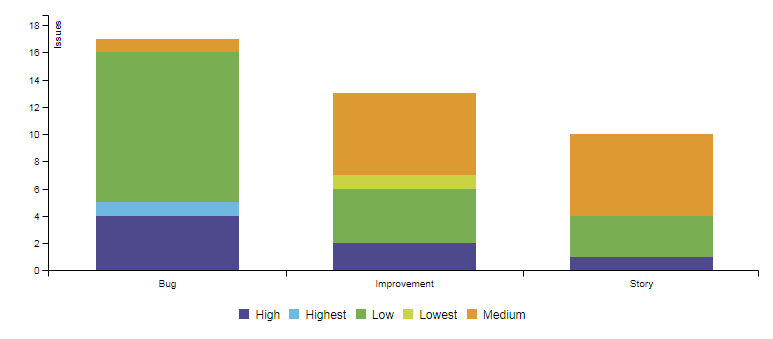
| Issue chart with custom value |
| Accumulated value issue chart grouped by any values. |
|
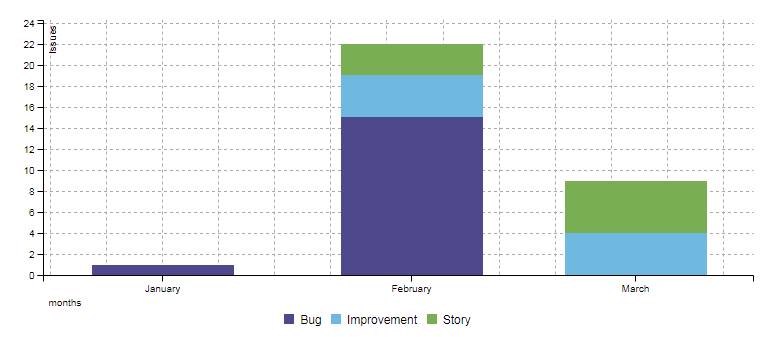
| Issue chart |
| Shows the amount of issues over time. Filter by using JQL and group by time unit or (custom) field. |
|
| Group by chart |
| Shows any issues grouped by any value. |
|
| Chronological worklog chart (Grouped by issue attribute) |
| Shows the amount of logged work. |
|
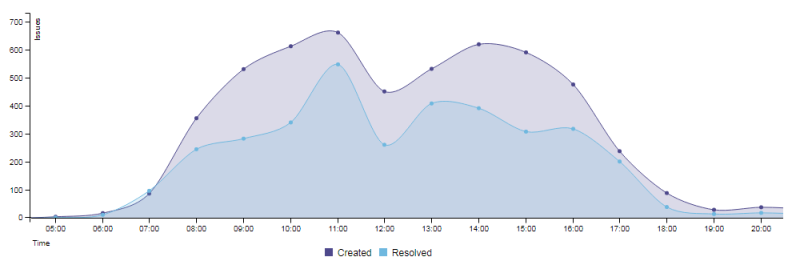
| Business hours |
| Shows when issues occurs and are resolved during working hours. |
|
Because we use the same layouts for multiple charts, we will show the most important ones here.
Built-in layouts
| Report | Chart preview | Description | Parameters |
|---|---|---|---|
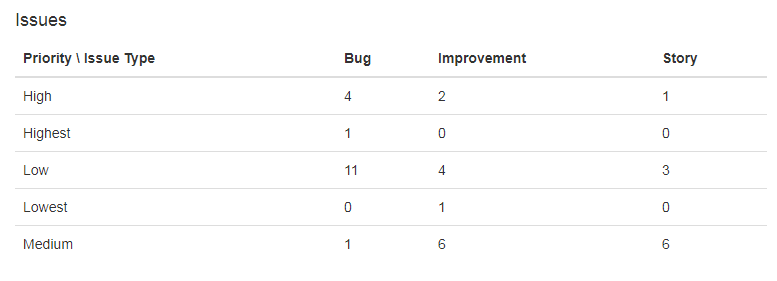
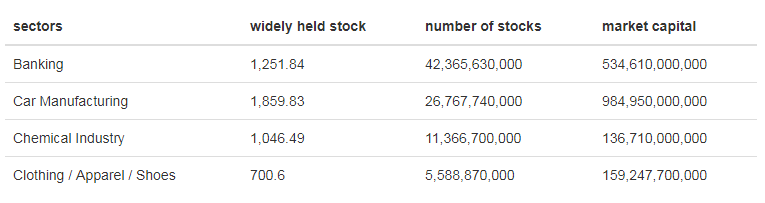
| Group By Report |
| Shows any issues group by any value. |
|
| Group By Report (multiple values) |
| Sum different fields grouped by a certain other field, display as table. |
|
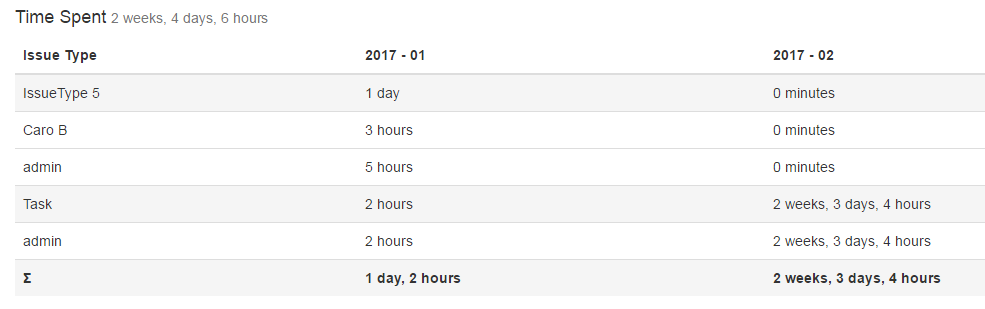
| Worklog Simple Group By Report |
| Displays work logs grouped by certain fields. |
|
If you still have questions, feel free to refer to our support team.