Analyzing log files is the key to successful troubleshooting. With Last Log for Confluence, you can analyze your log files directly in the Confluence administration interface.
- All log files in a single location: Select the log file you want to analyze from a practical sidebar with dropdown menus.
- Read your log files: Log files are displayed in an easily readable format with separated log entries and tagged meta information.
- Configure your log view: Use the tool bar to switch to classic mode, reverse your output, expand the log view or let your log file be automatically reloaded with new log entries every few seconds, simulating a live preview of your data.
- Search for information: The search bar makes it easy to find the precise log entries you're looking for. Use search terms, regular expressions and case sensitivity or switch to advanced search and configure filters via log level, user or timeframe.
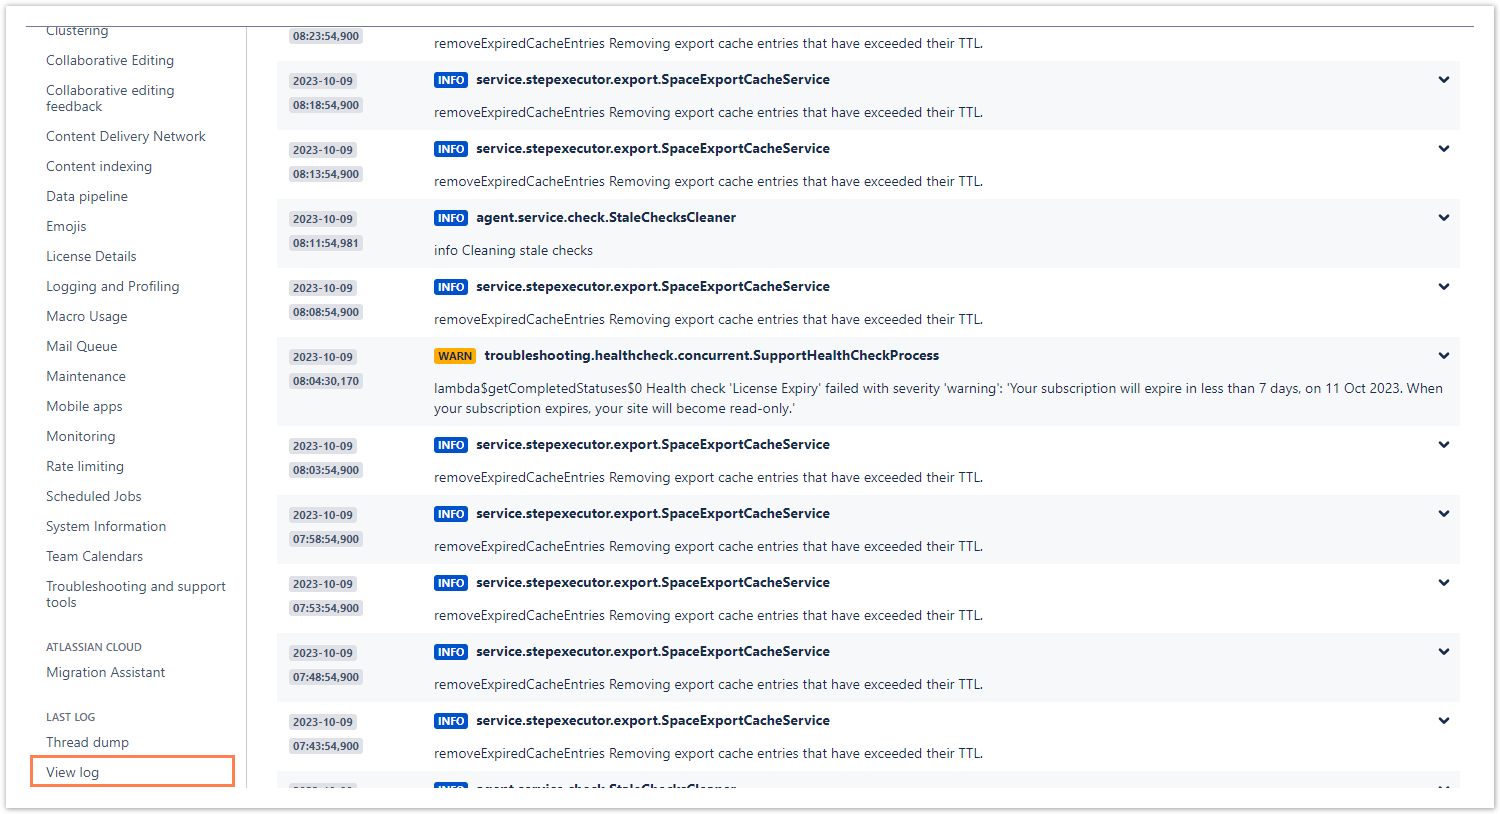
Access log files
You can access the log file overview by selecting View log in the left sidebar under the Last Log section.
Analyze log files
The Last Log app has an advanced graphical user interface including a sectioned overview of the current log, a sidebar displaying all available logs, a toolbar and a search bar. Within the search functionality you can switch between basic and advanced search. The interface makes it easy and straightforward to find what you're looking for among the raw data of the many different logs.
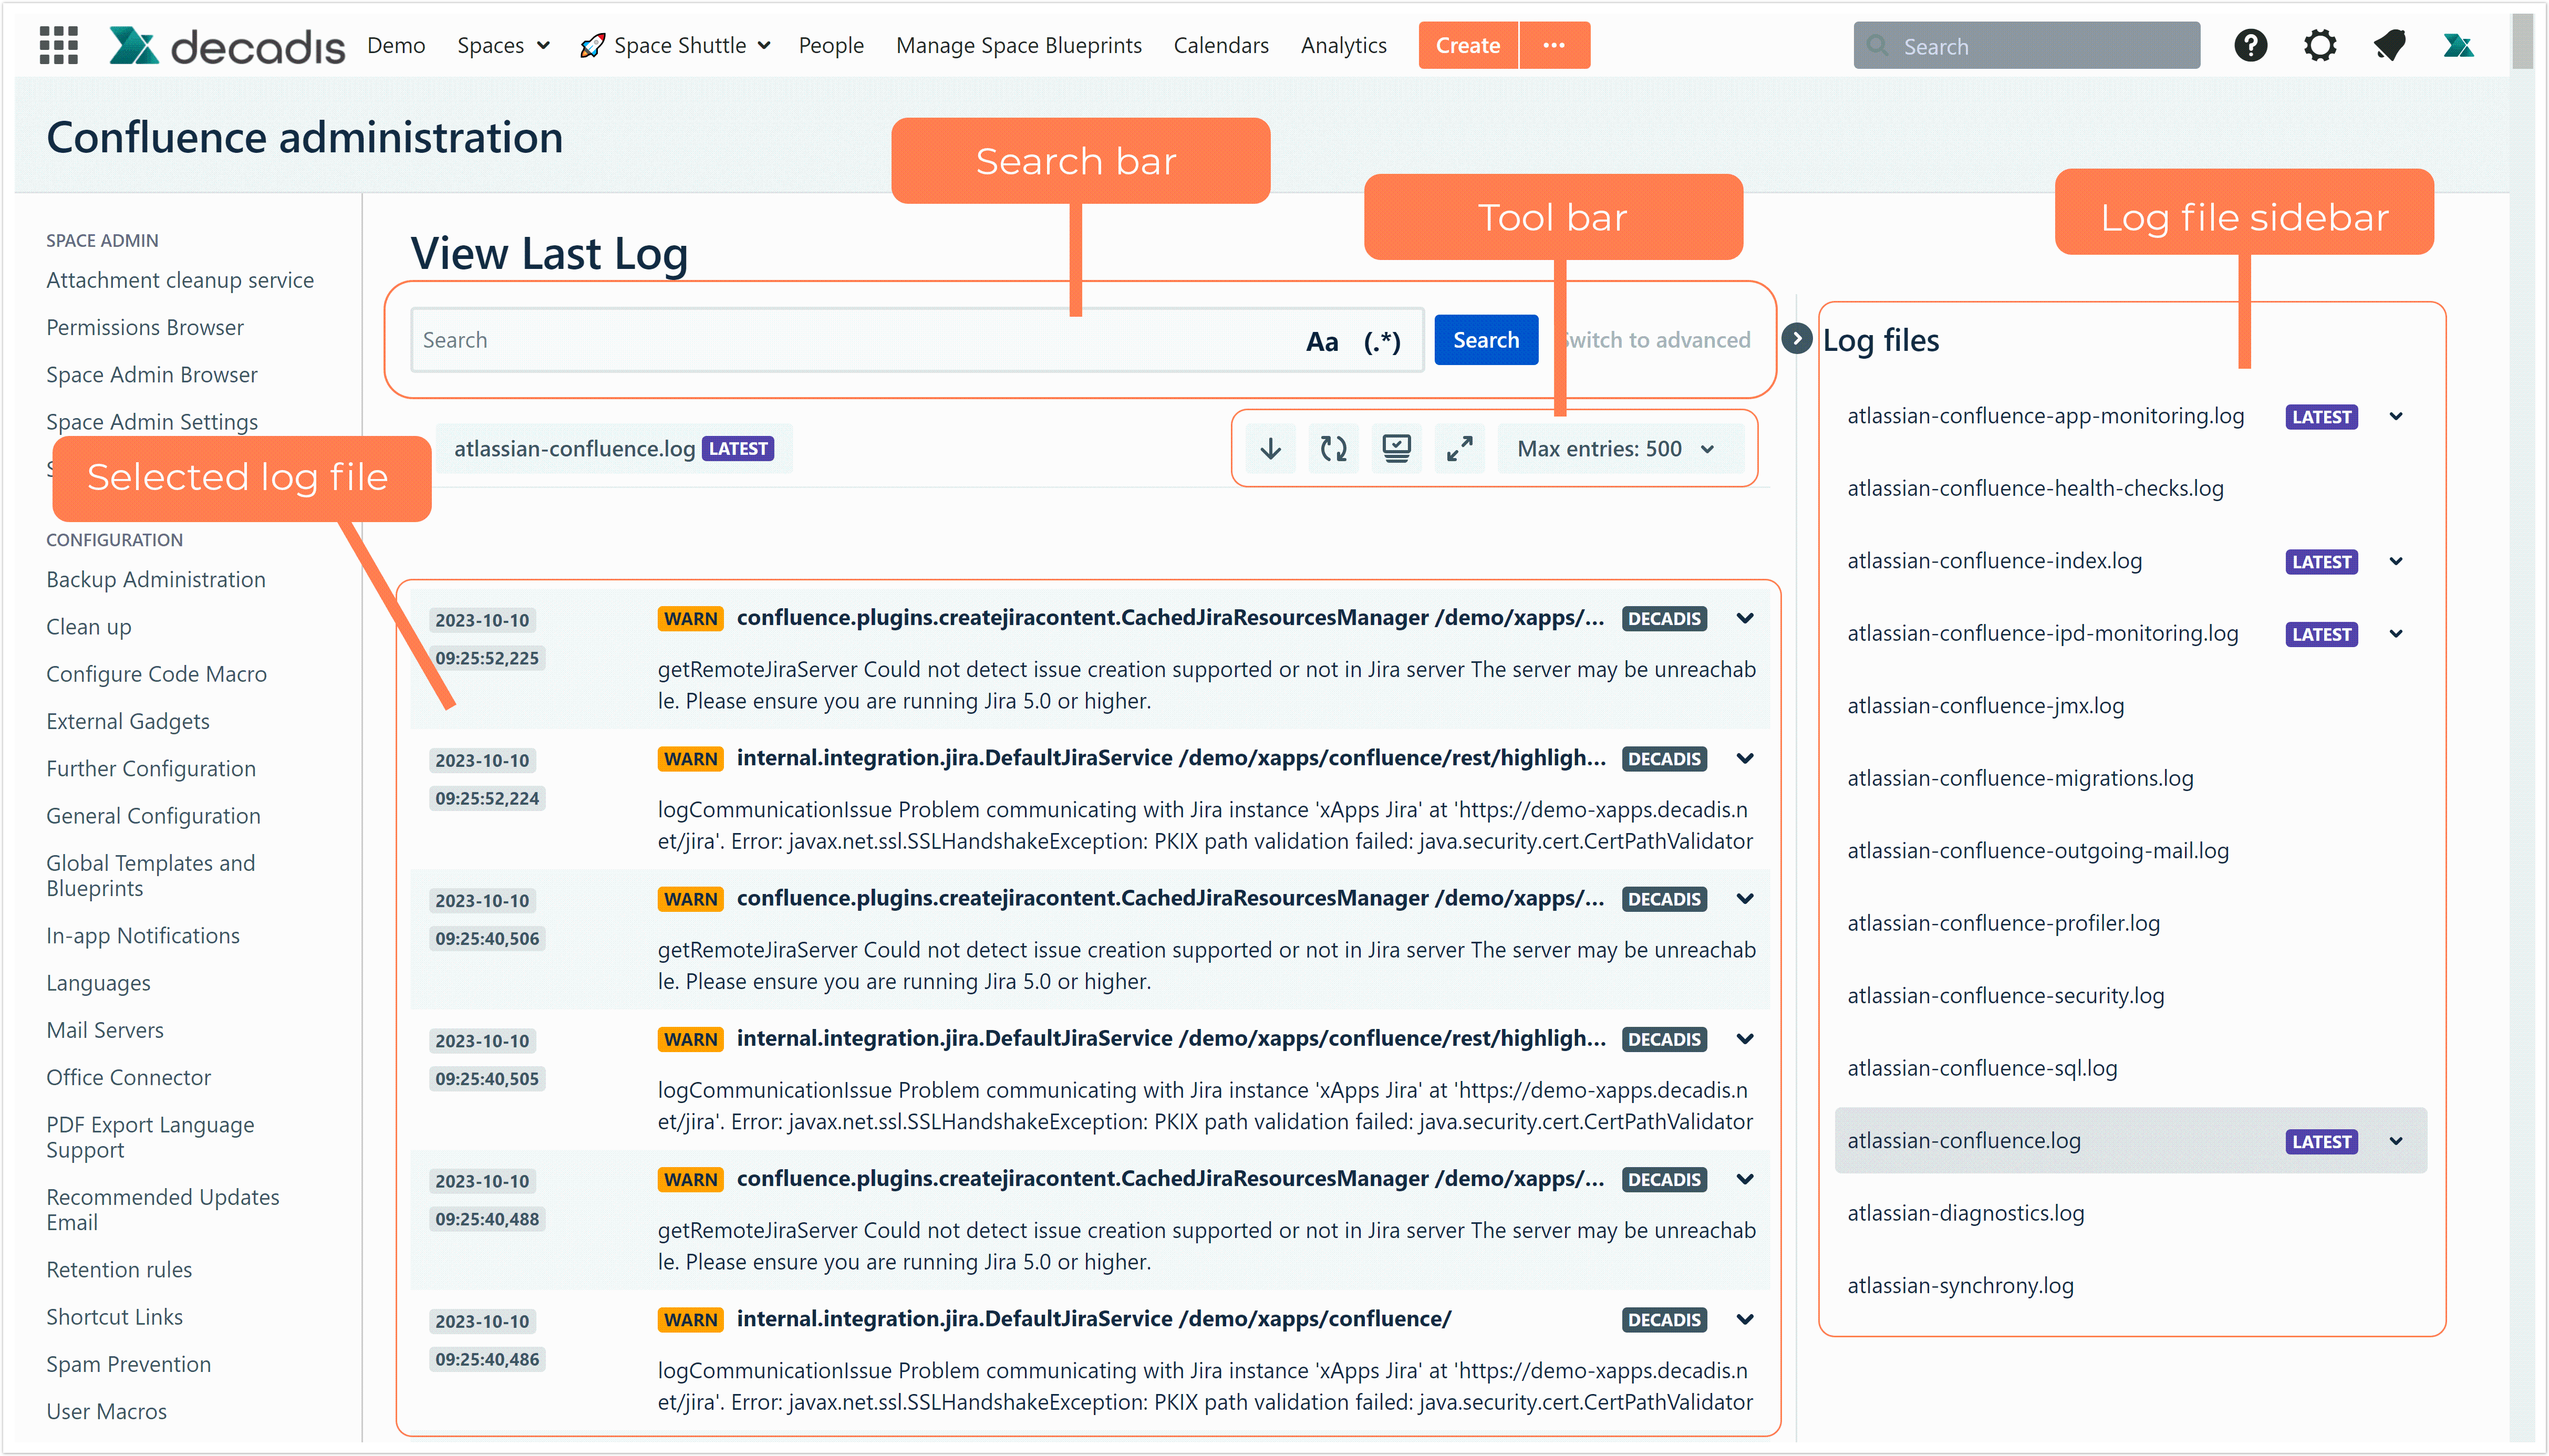
Select which log file you want to investigate in the main interface out of all available log files for your Confluence instance.
Click on the grey arrow button (top-right) to collapse or expand the sidebar to have more space for the main log view.
Click on any log file in the sidebar to select a log. The selected log will be opened in the main view.
Click on the arrow icon next to a log file to expand a dropdown menu with the available parts of the log file.
This option is present for all log files that are too large to be saved in a single file in the system. The grouping of files is shown because there are multiple files related to one log saved in your instance.
Clicking on Latest will select the latest updated log file. The other parts are numbered according to their sequence.

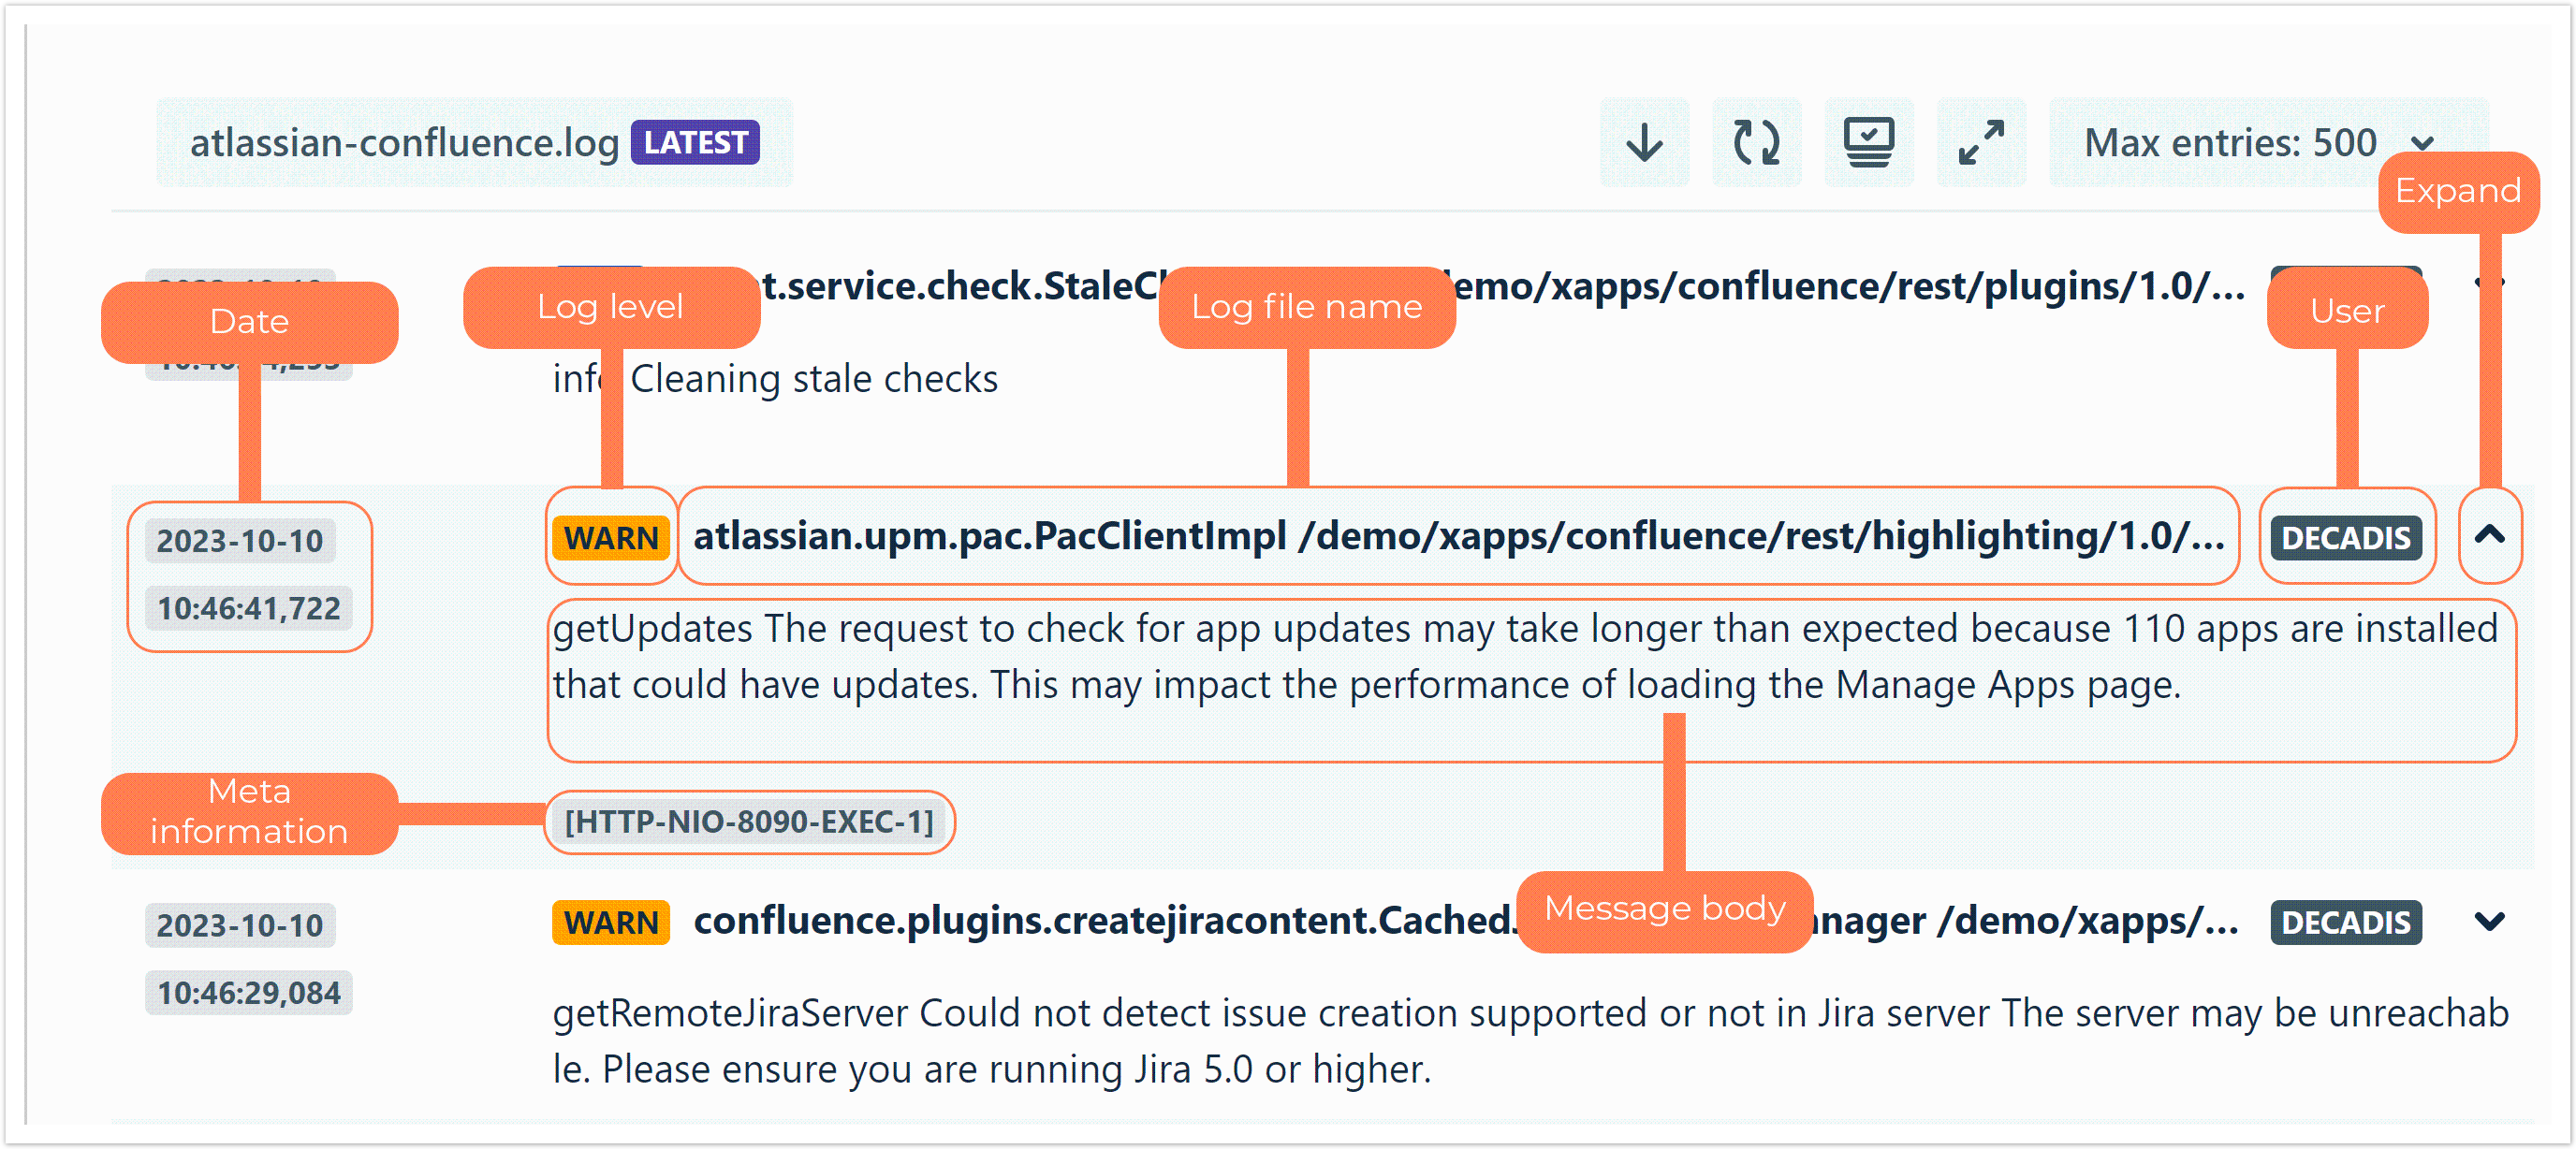
View the currently selected log file and analyze its contents.
The log file gets automatically divided into individual log messages which are displayed in a table format to provide an easier to understand overview.
In the right column you can view the date and time the message got logged.
In the left column you can view the log message itself.
At the top the log level (same level of the expand button), INFO, ERROR, WARN, DEBUG or FATAL is displayed as a colored label.
Besides that you can see the name of the log file and the name of the user who conducted the related action.
At the bottom of the message body you can view another label with meta information about the message.
see screenshot below for a better visual understanding
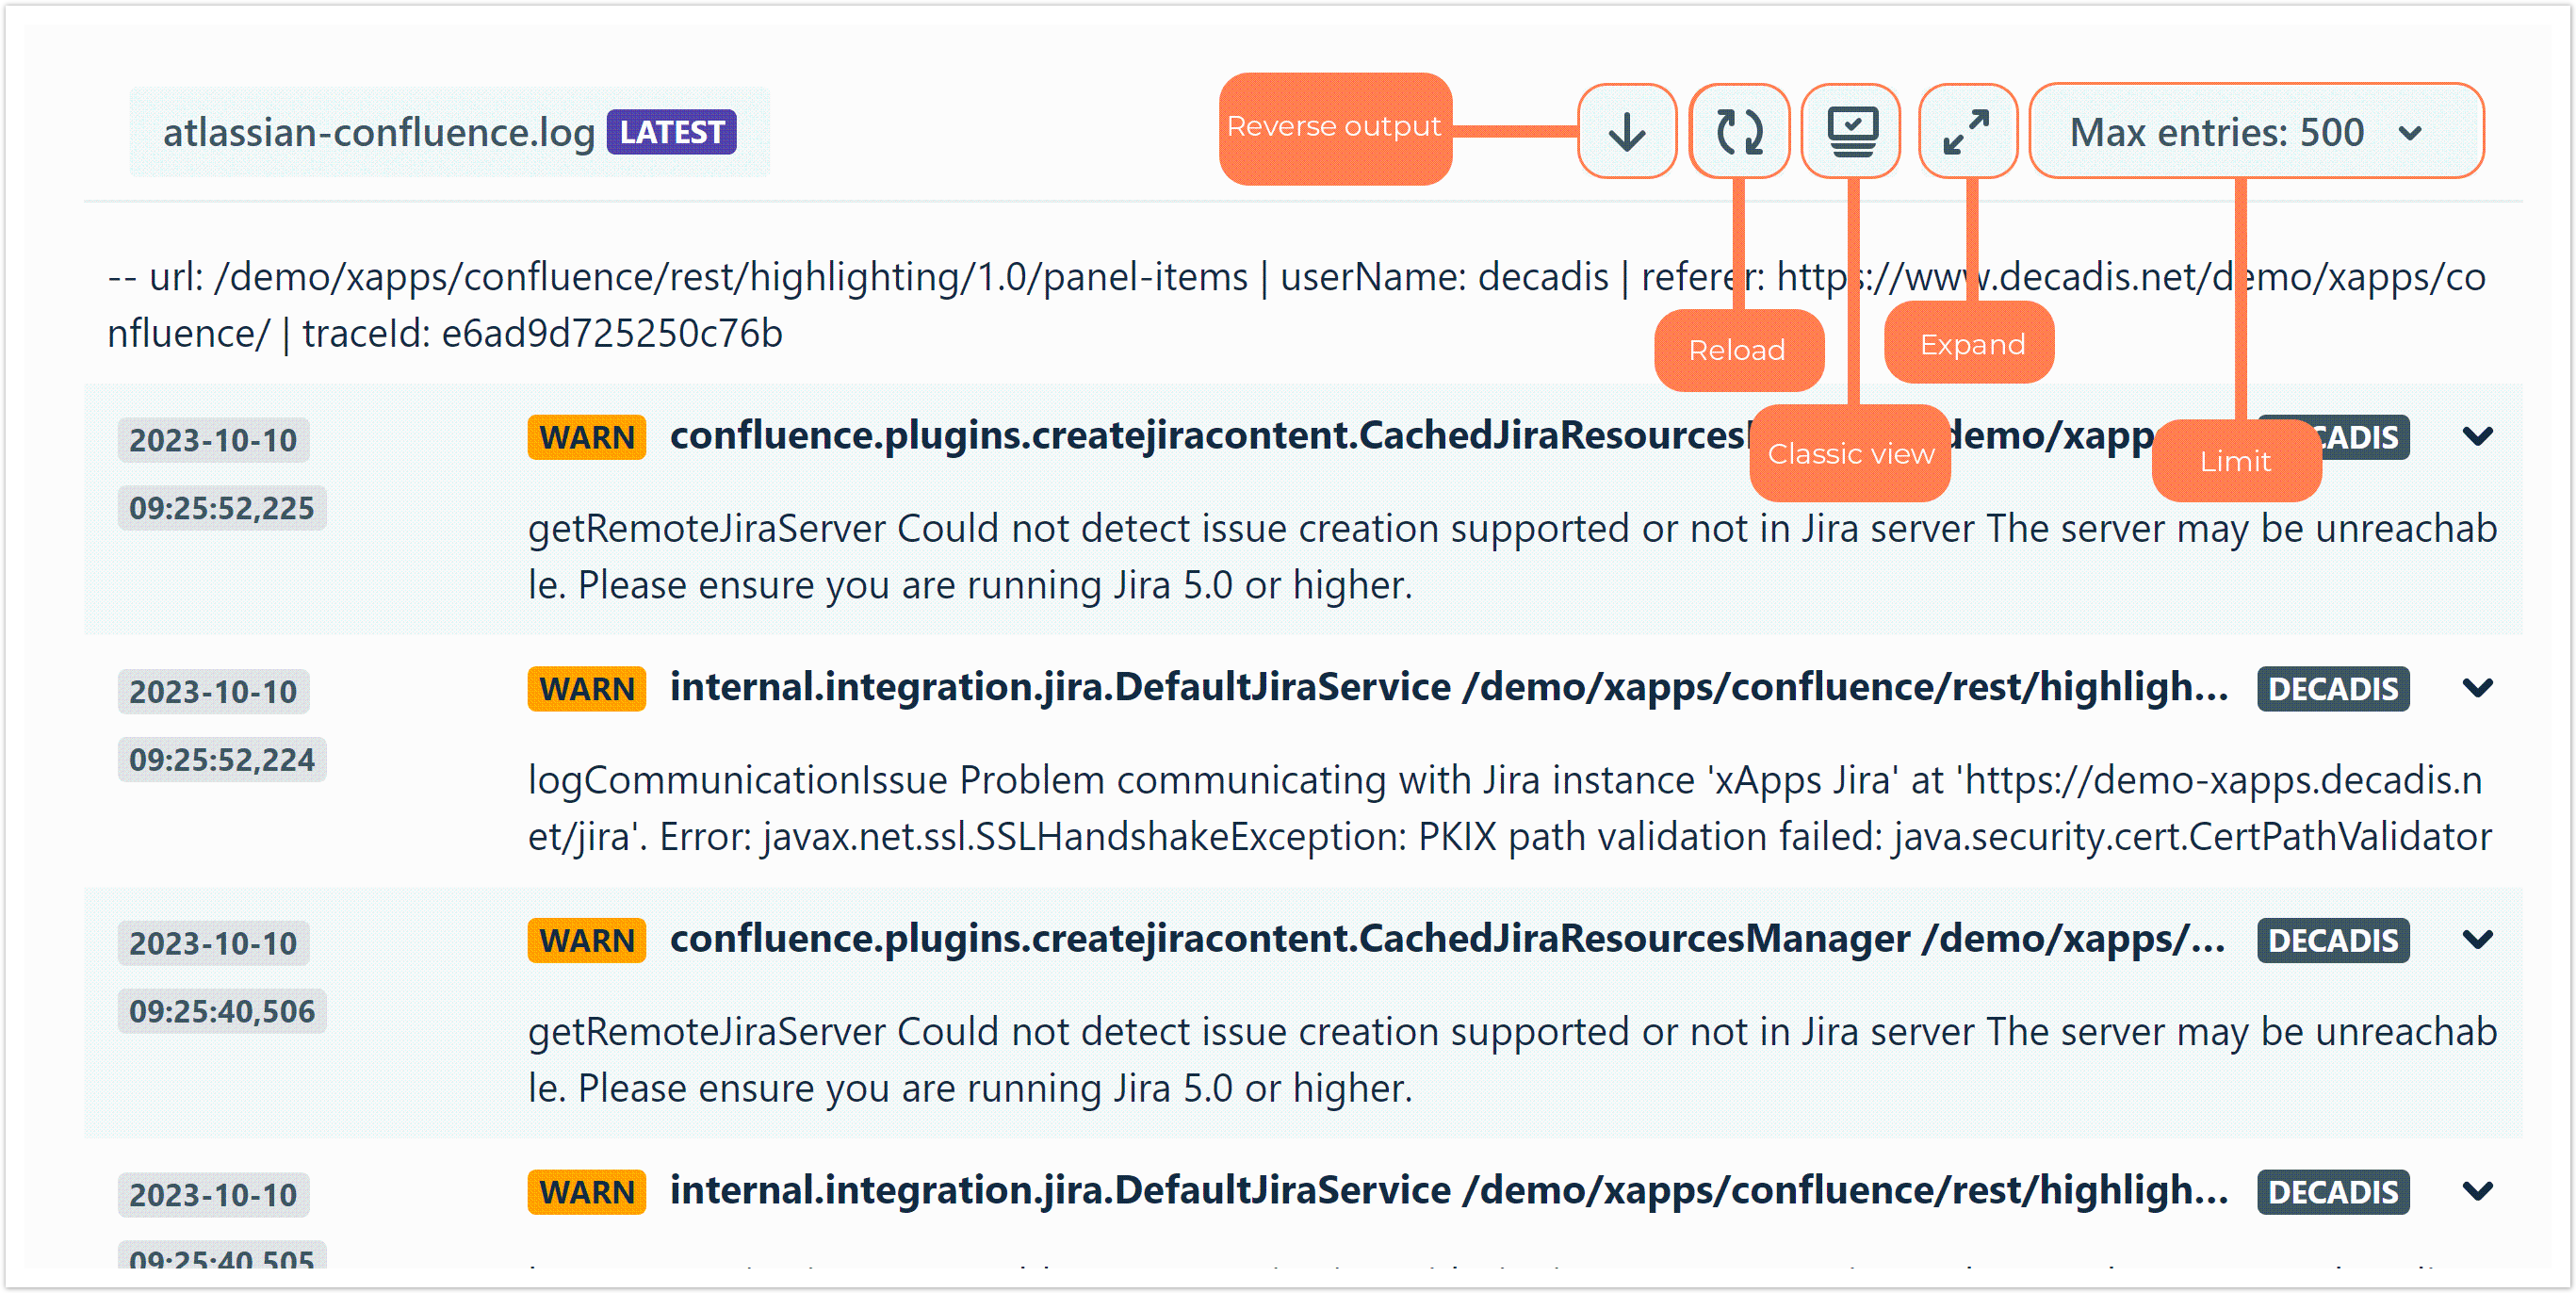
Change your log view according to your needs by utilizing several options from the tool bar.
Click on the reverse icon () to reverse the output of the log entries in the list, so that you see the last entries at the top.
Clicking on the icon a second time puts the list in the original order.
Click on the reload icon () to let the log view automatically reload every 5 seconds. New log entries will appear automatically in the list so that you can analyze the log file on a continuous basis.
Click on the icon again to deactivate the reload.
For large log files, activating the live refresh feature can take up a lot of resources and may lead to performance issues in your Confluence instance!
Click on the screen icon to switch to the classic view of the log file screen. Here the log entries are shown as raw data, as how they appear in the file instead of getting profiled and separated data into distinct entries like in the modern view. While meta information, like the date, the user and the log level can still be found within the raw data, you need to have a good grasp on the structure of the log entries to know where to find them. The classic view enables you to focus on the raw data itself if necessary, but makes it more difficult for you to swiftly look up important information.
Click on the icon again to switch back to the modern view if you're in the classic view.
Click on the expand icon to expand all log entries at once so that you can see the message bodies. Without using the expand option you would have to manually click on the expand arrow at the end of each entry to expand them. By using the icon in the tool bar you can save time and choose what part of the log file you want to focus on.
Limit the output in the table by specifying how many maximum entries should be shown. You can enter any number you want manually into the bar, the default is 500 entries.
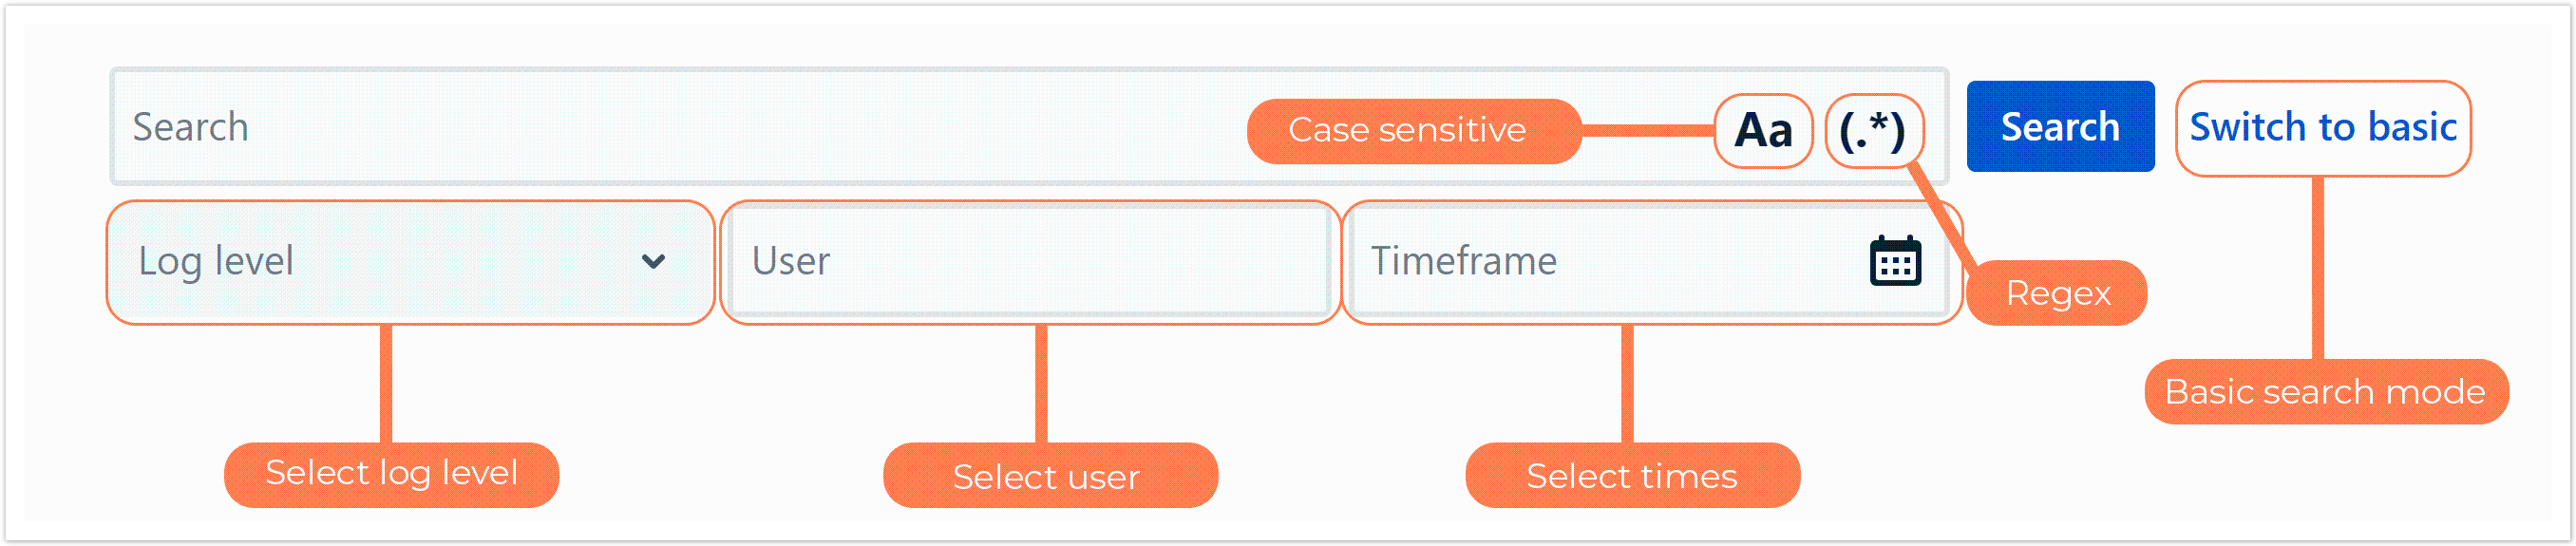
Filter the output of log entries in your currently selected file with the search bar. Switch between basic and advanced search according to your needs.
Click on the letter icon (Aa) to enable case sensitive search. If enabled, search terms you enter will only display results that match the case of the letters. For example, searching for the term "log1" will only display results that contain "log1" and not "Log1" or "LOG1".
Click on the icon a second time to disable case sensitive search and search in case insensitive mode. Here, searching for "log1" will also display results containing "Log1" or "LOG1".
Click on the regex icon to enable the search functionality with regular expressions.
A regular expression is a sequence of symbols and characters expressing a string or pattern to be searched for within a longer piece of text. For example, you can search for words that start or end with certain characters and contain or don't contain certain characters.
Click on Switch to basic to switch to basic search where advanced filtering options under the search bar aren't available.
If you're in basic search mode, click on Switch to advanced to switch to advanced search.
In advanced search mode, you can configure further filters to trim down the output of the log entries:
- Log level: Filter by one or multiple log levels (ERROR, WARN, DEBUG, INFO and FATAL). This shows only log entries which are of the specified log type.
- User: Filter by user name. This shows only log entries which are associated with the specified user.
- Timeframe: Filter by date and time. This shows only log entries which are from within the specified timeframe.
If you still have questions, feel free to refer to our support team.