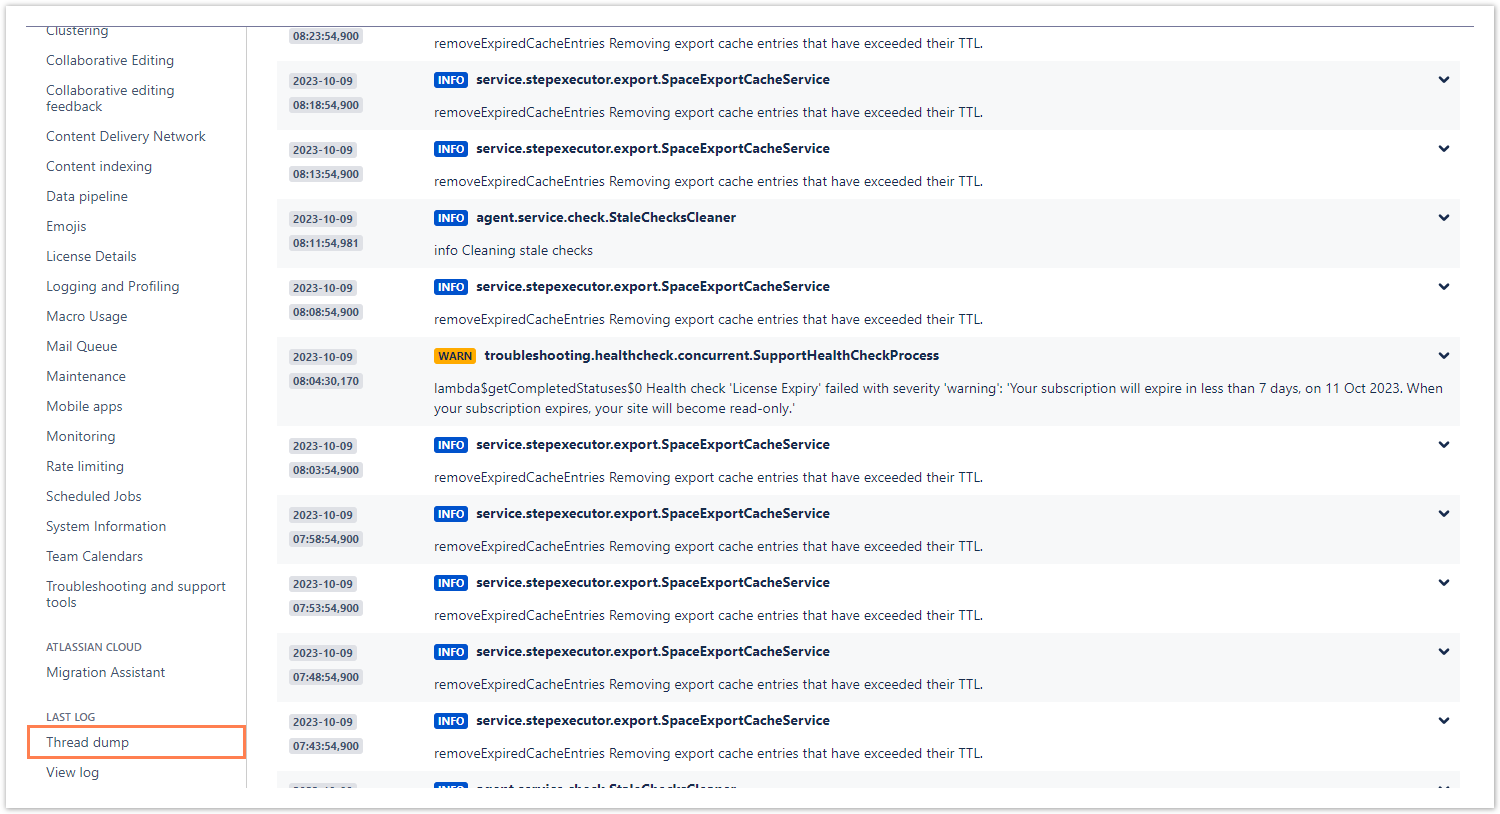
A thread dump is a snapshot of the state of all threads that are running in your Confluence instance at the moment. Last log lets you analyze the current thread dump with a single click.
Analyzing thread dumps is very useful when trying to resolve performance problems or other issues with your Confluence instance. For example, you can gather thread dumps in repeated intervals to see whether a certain thread is running for a long time and never finishes which usually takes a hit on performance. Killing the particular thread can free up resources and speed up the other processes in your Confluence instance.
Access thread dump
You can access the thread dump by selecting Thread dump in the left sidebar under the Last Log section.
Analyze thread dump
You will be taken directly to the thread dump which gets opened as a plaintext file in a separate tab.
Here you can see the name of the thread, the state of the thread such as RUNNABLE and the stack trace itself showing what the thread in question is doing at the moment.
When analyzing thread dumps it's important to filter out the noise and find what you're looking for among the unprocessed data. Henceforth, it is recommended to open the thread dump with a clear plan in mind of what information you'd like to gather from it.
If you still have questions, feel free to refer to our support team.
