As a marketing team, we understand that it is important to keep track of your expenses. You will be able to see the difference in no time! That is why sumUp is here to help! Our Grouped Filter Results gadget makes it easy to compare your actual costs with your budget. In this example, you will learn how to use sumUp to compare last year's budget and costs per quarter.
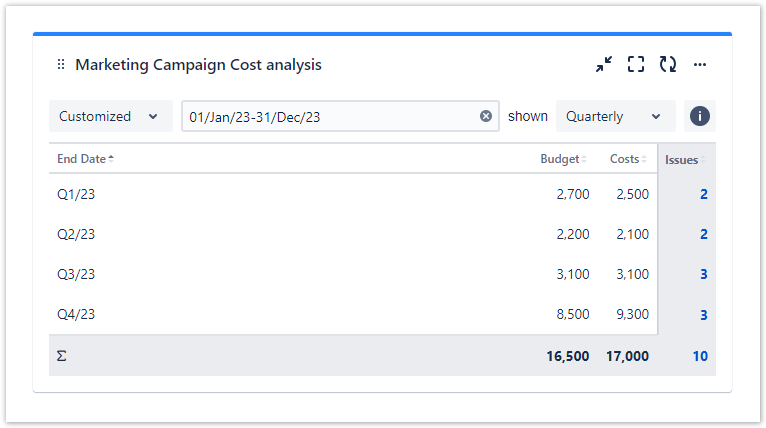
As you can see, we have configured the gadget so that you can see the budget for each quarter and the total cost and number of issues. On the bottom of the gadget you can see the total budget for the year and the total cost and total number of issues. At the top you can see the options to select a different time period.
We switched from the configured option All-time to a customized time period to display the data for 2023.
You can tweak the date options on top of the gadget at any time without breaking your configurations.
Configuration
| Option | Settings |
|---|---|
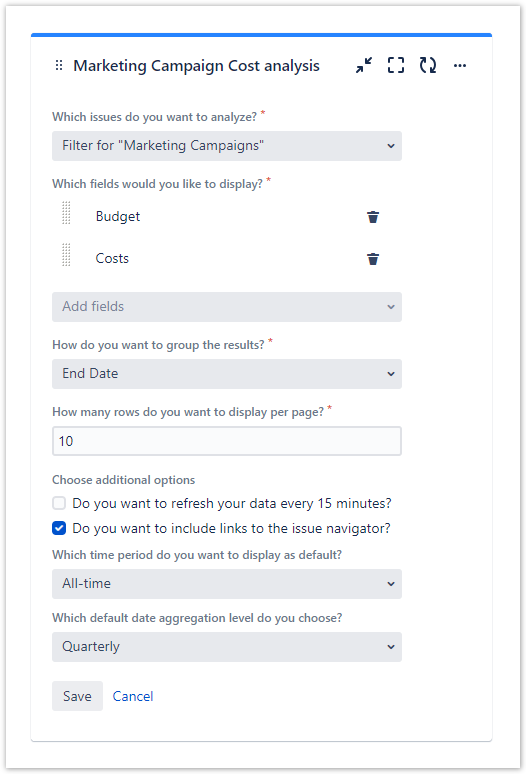
| Which issues do you want to analyze? | Select the Filter Filter for "Marketing Campaigns", which returns all issues of the Marketing Campaign project and was defined in advance. |
| Which fields would you like to display? | To compare the budget and cost select Budget and Costs. |
| How do you want to group the results? | Group the results by End Date to ensure the costs are correctly grouped. End Date is a custom date field that must also be created. |
| How many rows do you want to display per page? | For a quarterly view, there are only four entries. Therefore, the default option of 10 rows is enough. |
| Choose additional options | The gadget will only refresh when you reload the gadget, if Do you want to refresh your data every 15 minutes? is not checked. If you want to have a direct link to the related issues, check Do you want to include links to the issue navigator? |
| Which time period do you want to display as default? | Select All-time. |
| Which default date aggregation do you choose? | To view each qaurter separately, select Quarterly. |
If you still have questions, feel free to refer to our support team.