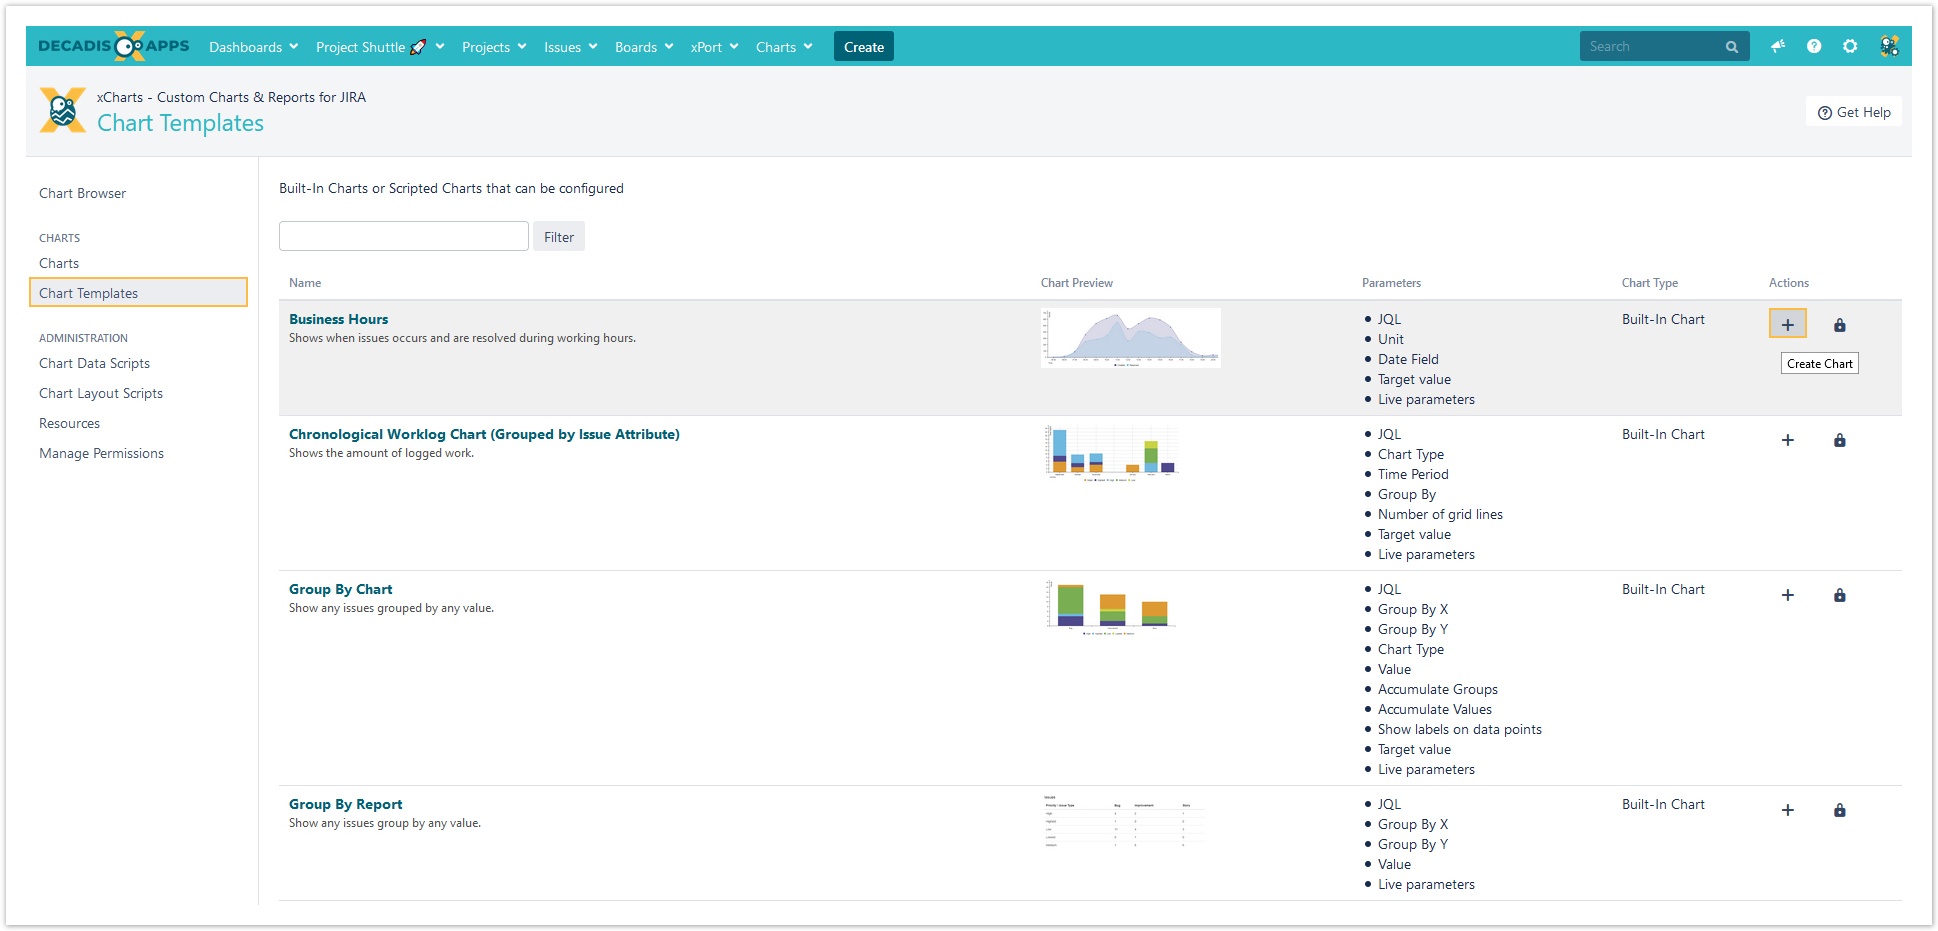
Creating a brand new chart can easily be done by using one of the many built-in templates.
Head over to the new tab Charts → Chart templates and click on the + button under actions:
On the upcoming page, the chart can be configured according to the specific needs by e.g. entering a JQL or selecting a Field to be summed up.
After setting the chart up it can be previewed by hitting "Chart preview".
Finally, the chart can be saved by clicking on "Save as chart".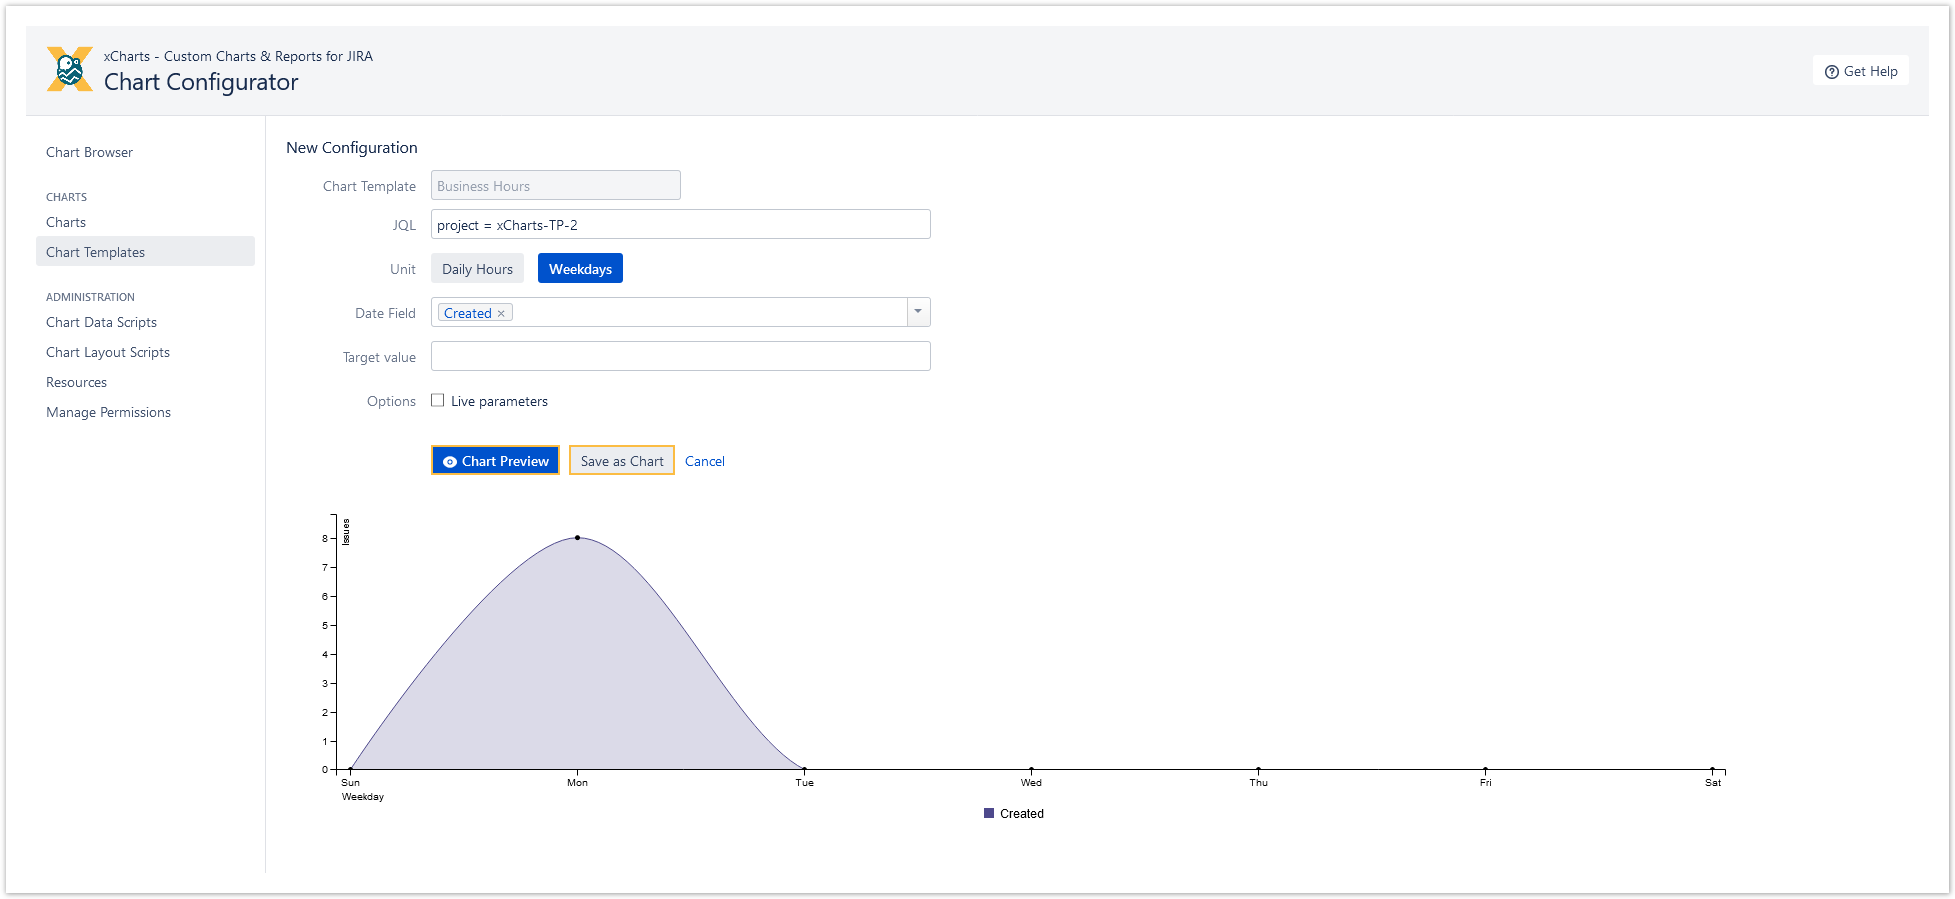
Created charts can then be accessed by either going to the "Chart browser" or by clicking "Charts" in the sidebar.
If you still have questions, feel free to refer to our support team.