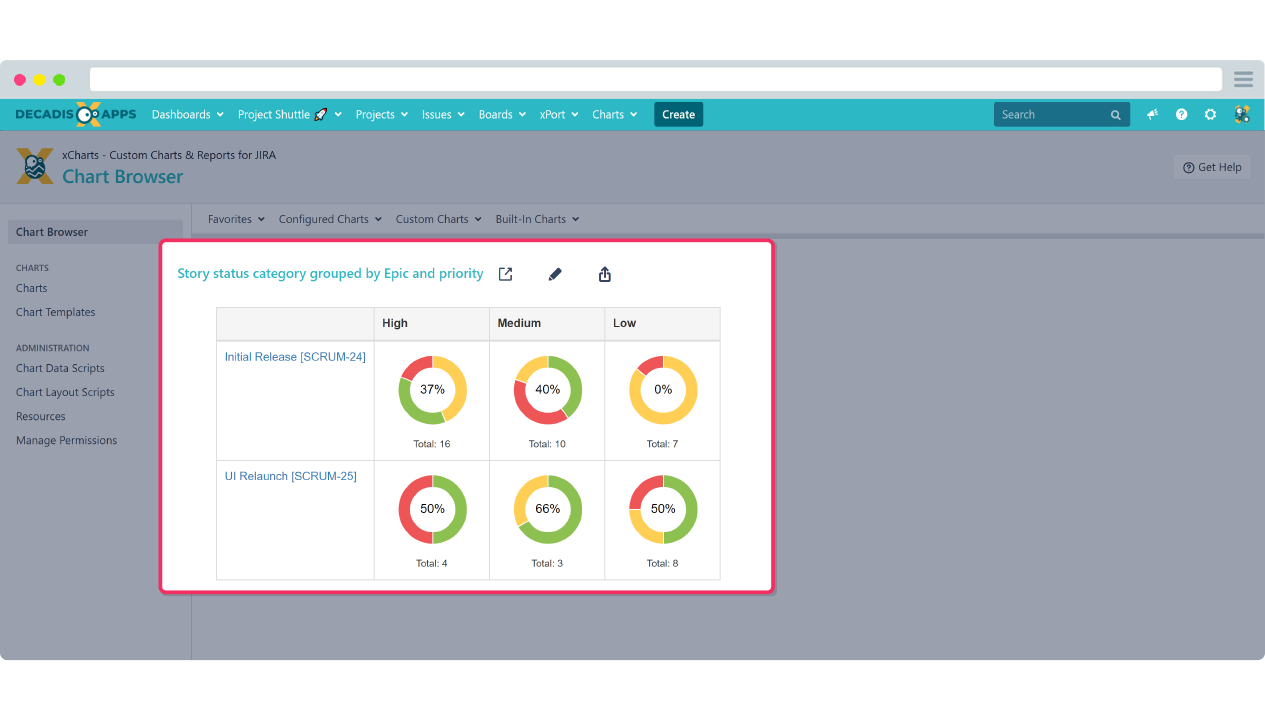
Built-in chart templates for every need
The presentation of data is so essential that no user should need programming skills to visualize the company, project, or issue data. And you don't have to!
- The choice is yours - choose from more than a dozen templates to let your data shine.
- Something for every taste - layouts range from pie charts to multiple types of bars, tables, and line charts.
- Just a click away - easily manage created charts and templates using the chart browser directly from the Jira top menu navigation.
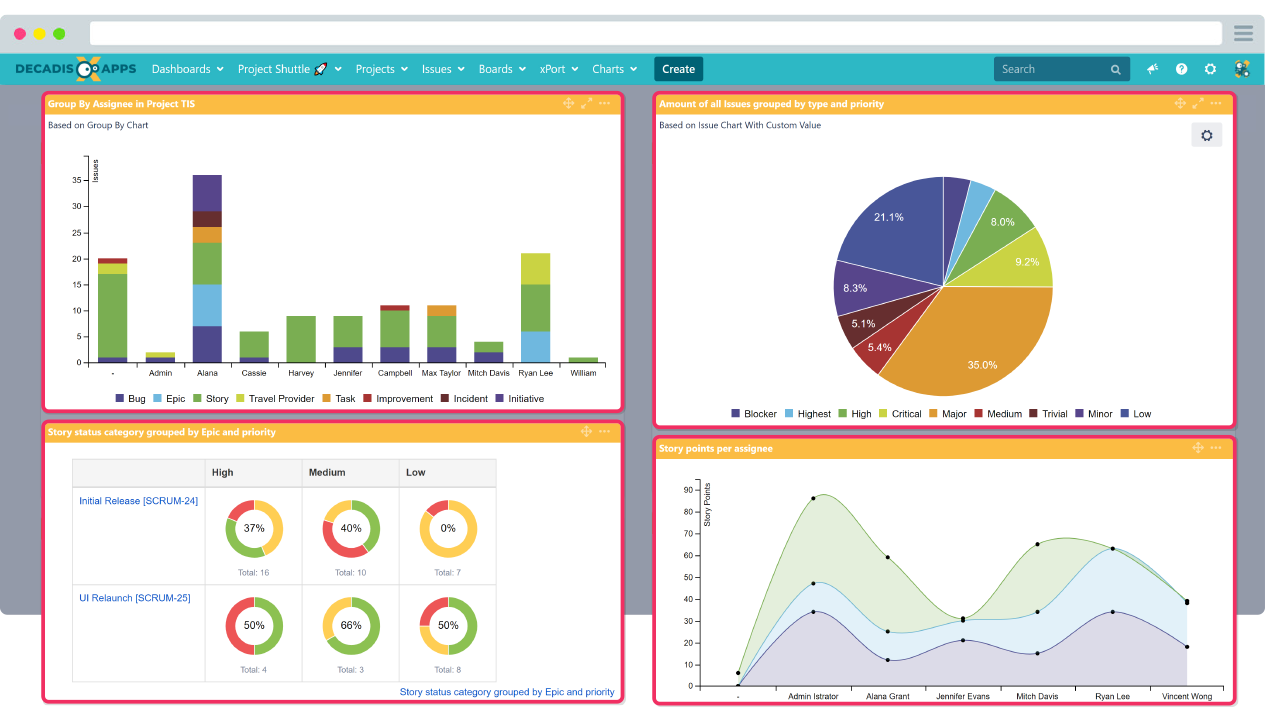
Dashboard gadgets with static and live configuration
Two gadgets are enough for all the charts in the world. And that's exactly the amount of gadgets that come with xCharts for Jira. They complement each other to satisfy the entire range of your reporting needs.
- Play it safe - use our standard dashboard gadget for static display of charts on as many dashboards as you like.
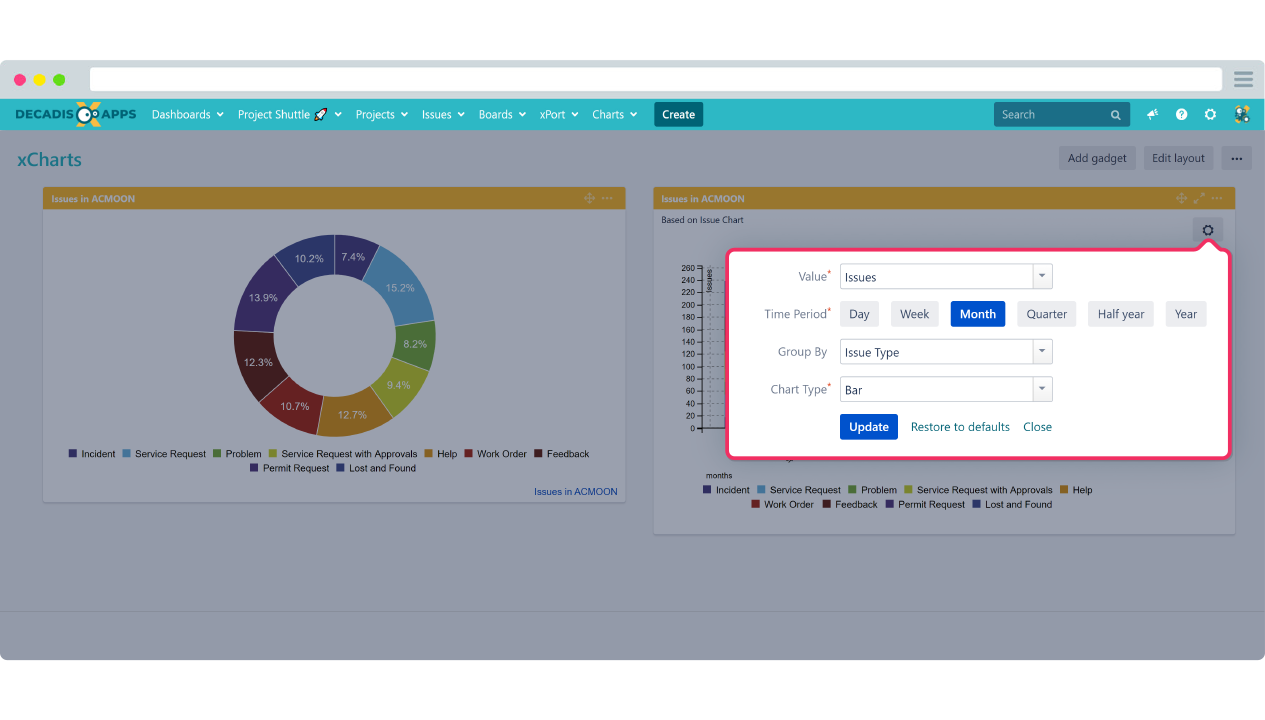
- Designed for interaction - use the xChart Gadget+ to enhance the built-in charts with configurable parameters directly on the dashboard.
- Works in Confluence - use our standard gadget on any Confluence page to visualize Jira content and break down the reporting data silo.
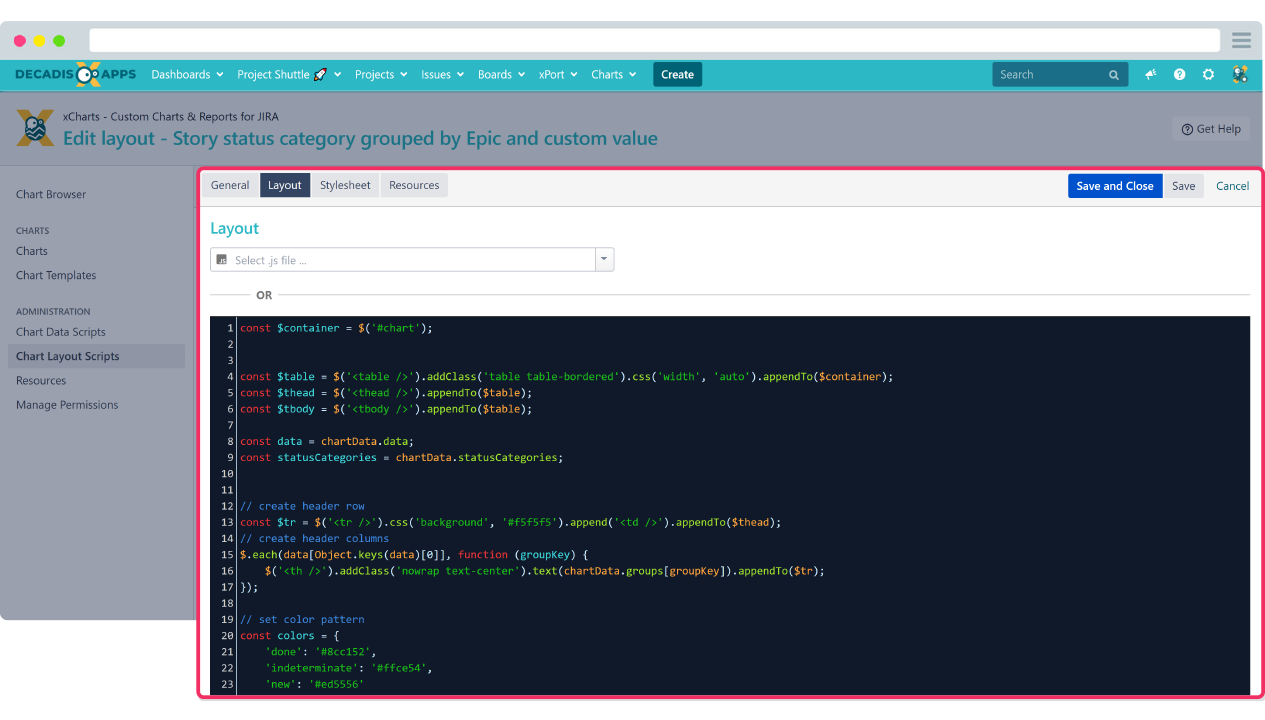
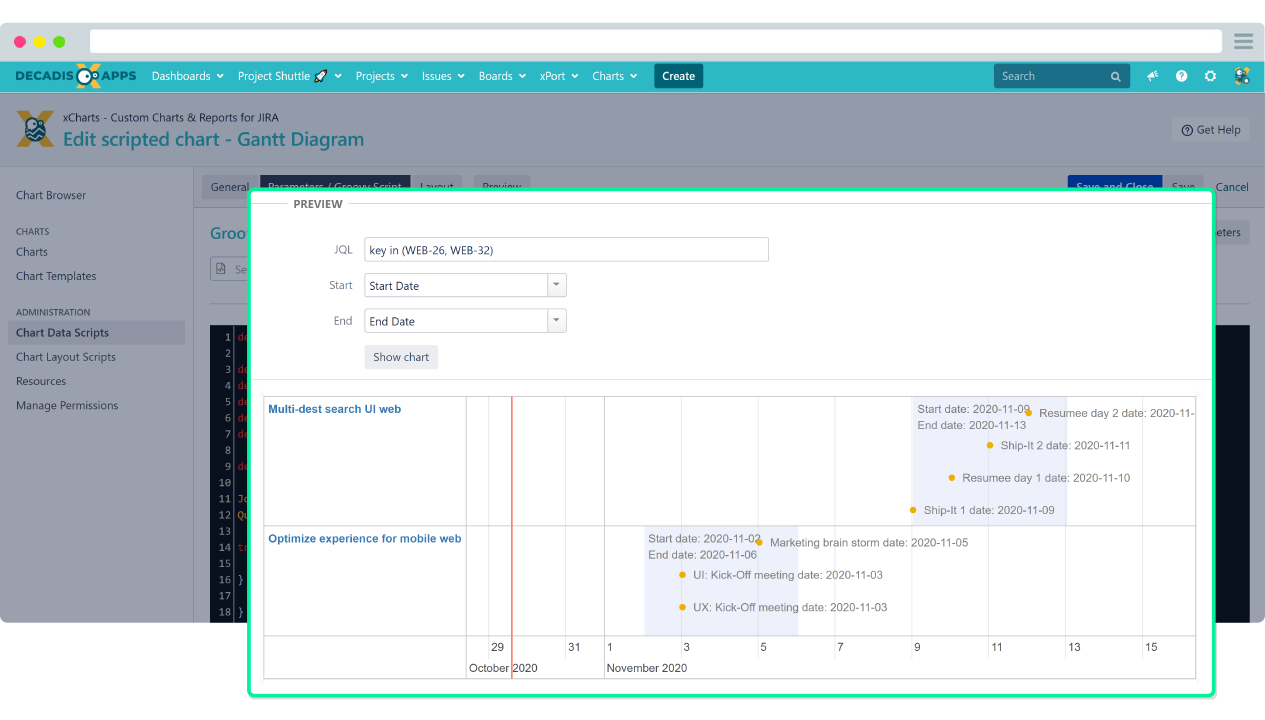
Scripting capabilities for custom charts to go beyond
There is no single diagram that works for all reporting needs. Implement your own custom data visualization using Groovy scripts. Build them from scratch or modify existing templates and create highly customizable diagrams ranging from fully parameterized charts to pre-defined charts offering more guidance and leaving less room for misconfiguration - nothing is impossible!
- Smart and beautiful - the support of the C3.js library opens up extensive customization possibilities.
- Extend and brand - Add your own resources like Javascript libraries or CSS files for reusing them across charts and additional customizing options.
- Connect the dots - pull in data from external sources like databases or web services.
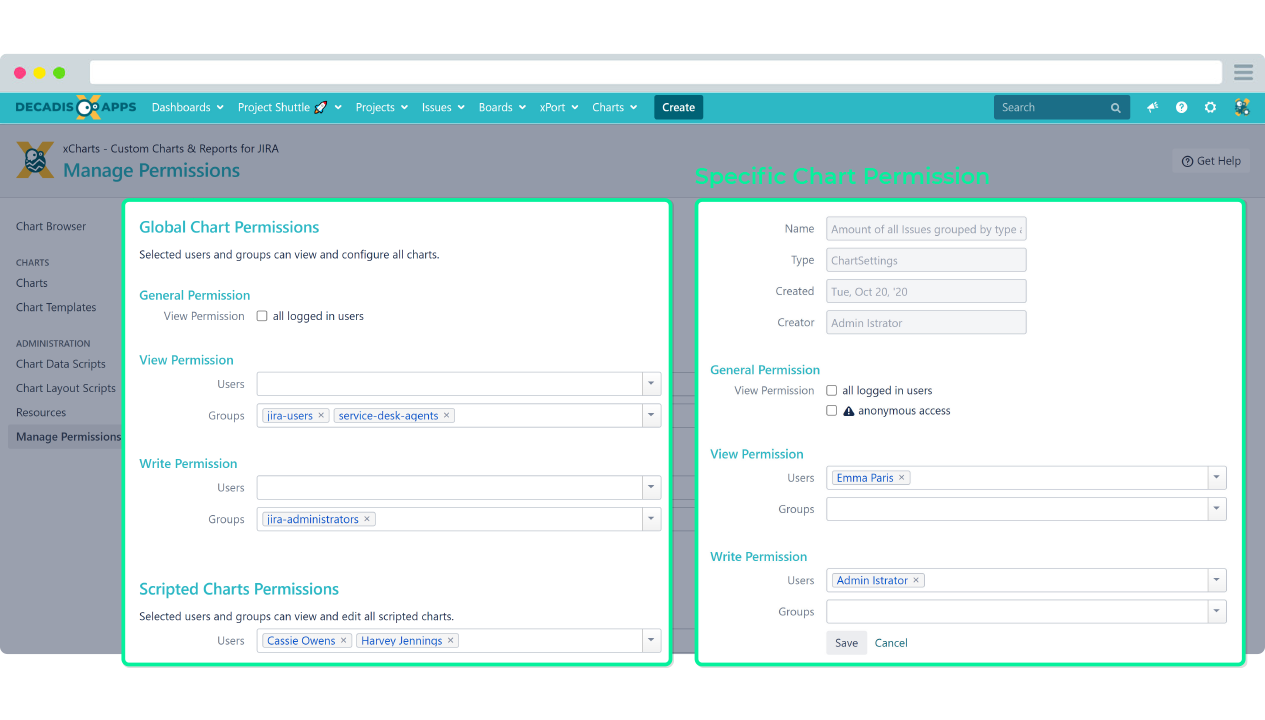
Advanced permission management
A straightforward and simple permissions management helps you meet all your users' needs while granting privileges based on their abilities. This is just an option - not an obligation.
- Reporting only - Grant access to configured charts in the chart browser and the dashboards gadgets.
- Contributors welcome - Enable users to create new charts from templates to meet new requirements.
- The real reporting MVP - Create scripted charts and make them available as templates for further use.
Publishing and migrating charts & reports
xCharts for Jira is designed as an open system. Scripted charts can be easily moved between instances with built-in functionality. In addition, you can take advantage of the expressiveness of your charts to enhance documents and presentations by simply exporting them to graphic files.
- Test and deploy - easily migrate your chart scripts between instances as scripted chart bundles.
- Show and tell - export charts and reports as PNG and SVG graphic file formats from the chart browser.
- Need inspiration? Download as many chart examples as you like from our documentation - at no cost.