xCharts is a charting app that allows generating custom charts & reports directly within Jira to visualize projects and issue analysis. New charts can easily be created in no time by using chart & report templates. Furthermore, these templates can be expanded by just scripting your own charts using Groovy and Javascript.
After installing xCharts, a charts tab will appear on your Jira's navigation bar:
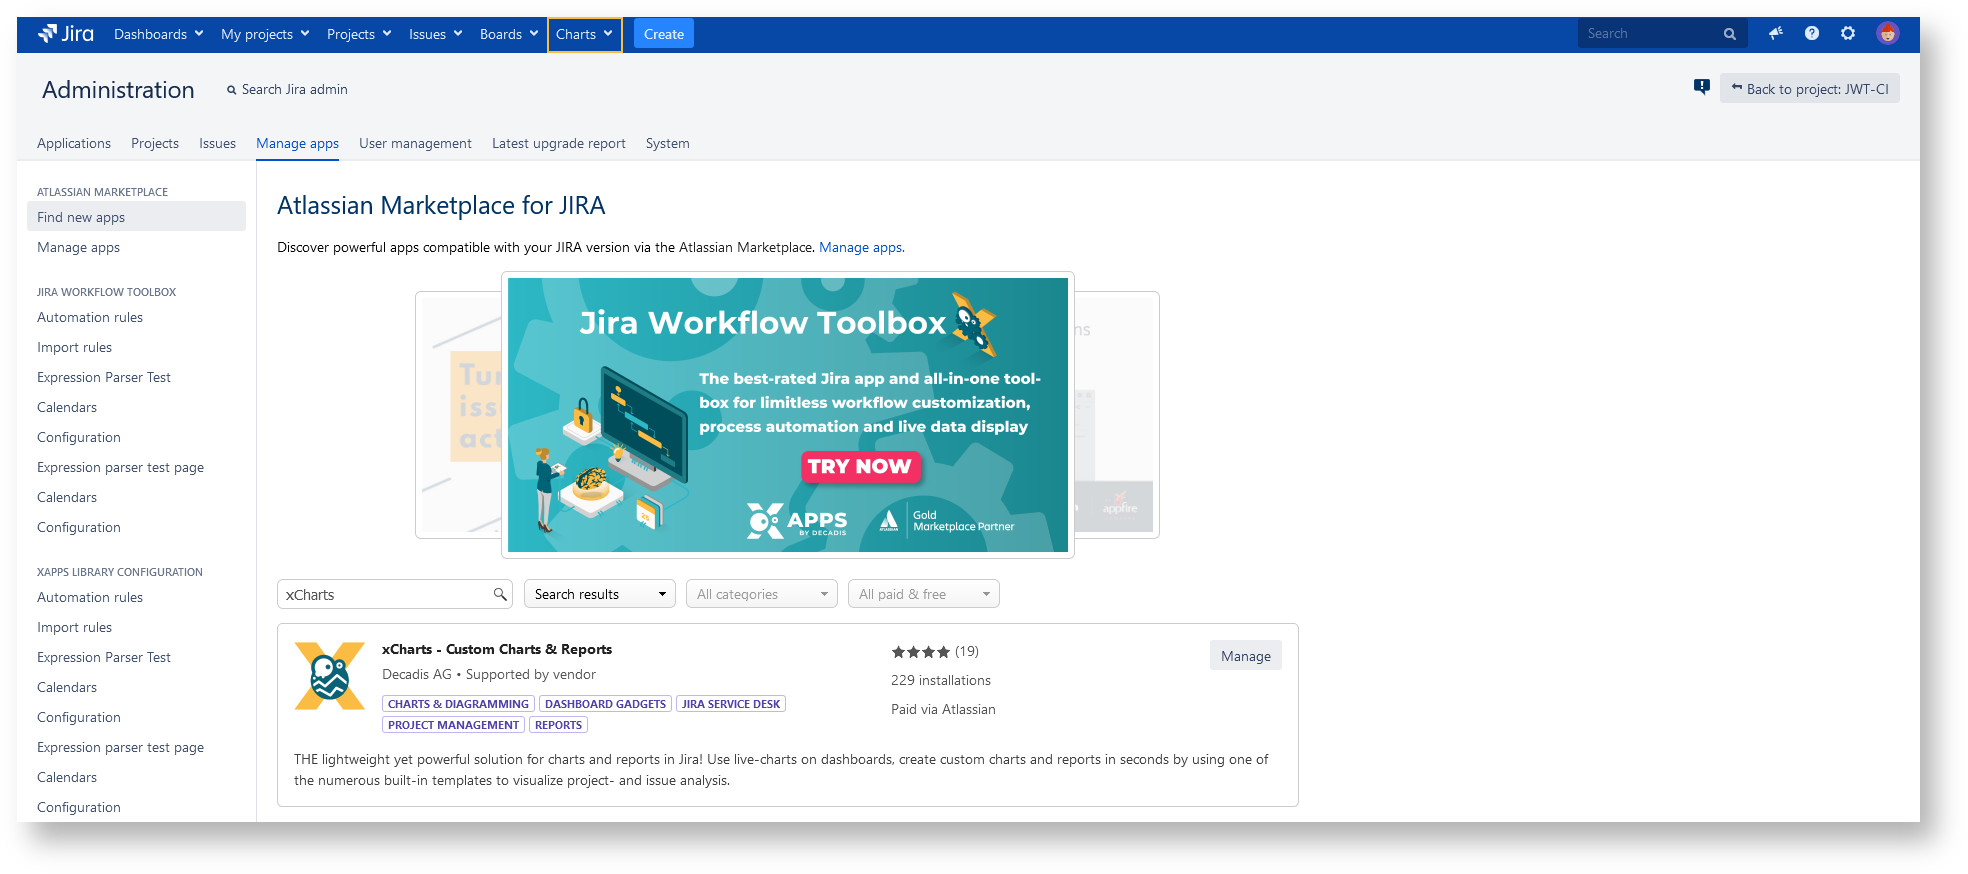
Get to know xCharts
The Chart browser can be used for browsing through all created charts, grouped by:
- Favorites: Lists all charts that are marked as favorite
- Configured charts: Lists all saved chart configurations based on Built-in charts.
- Custom charts: Lists all saved chart configurations based on Scripted charts.
- Built-in charts: Lists all built-in charts where no configuration is needed
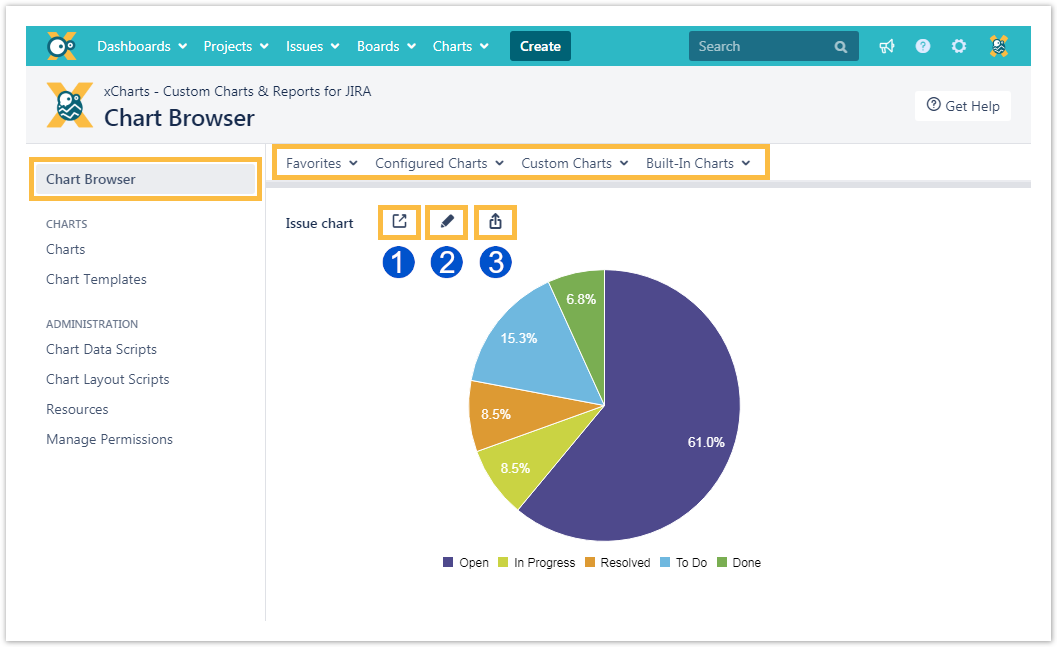
Additionally, it is possible to:
- Open the chart in a new tab
- Edit the chart configuration
- Export the chart as PNG or SVG.
Here are all charts listed that can be viewed by the current user. If he does not have the required permission, the chart won't be shown.
Charts can be viewed by clicking on the chart name.
Favorite: Shows whether a chart is marked as favorite or not.
Available chart types:
- Built-in chart: A built-in chart where no parameters are needed.
- Configured chart: A chart based on a template.
- Scripted chart: A chart based on a Chart data script.

This page gives you an overview about all configurable built-in & scripted charts. New charts can be created by clicking the + button.
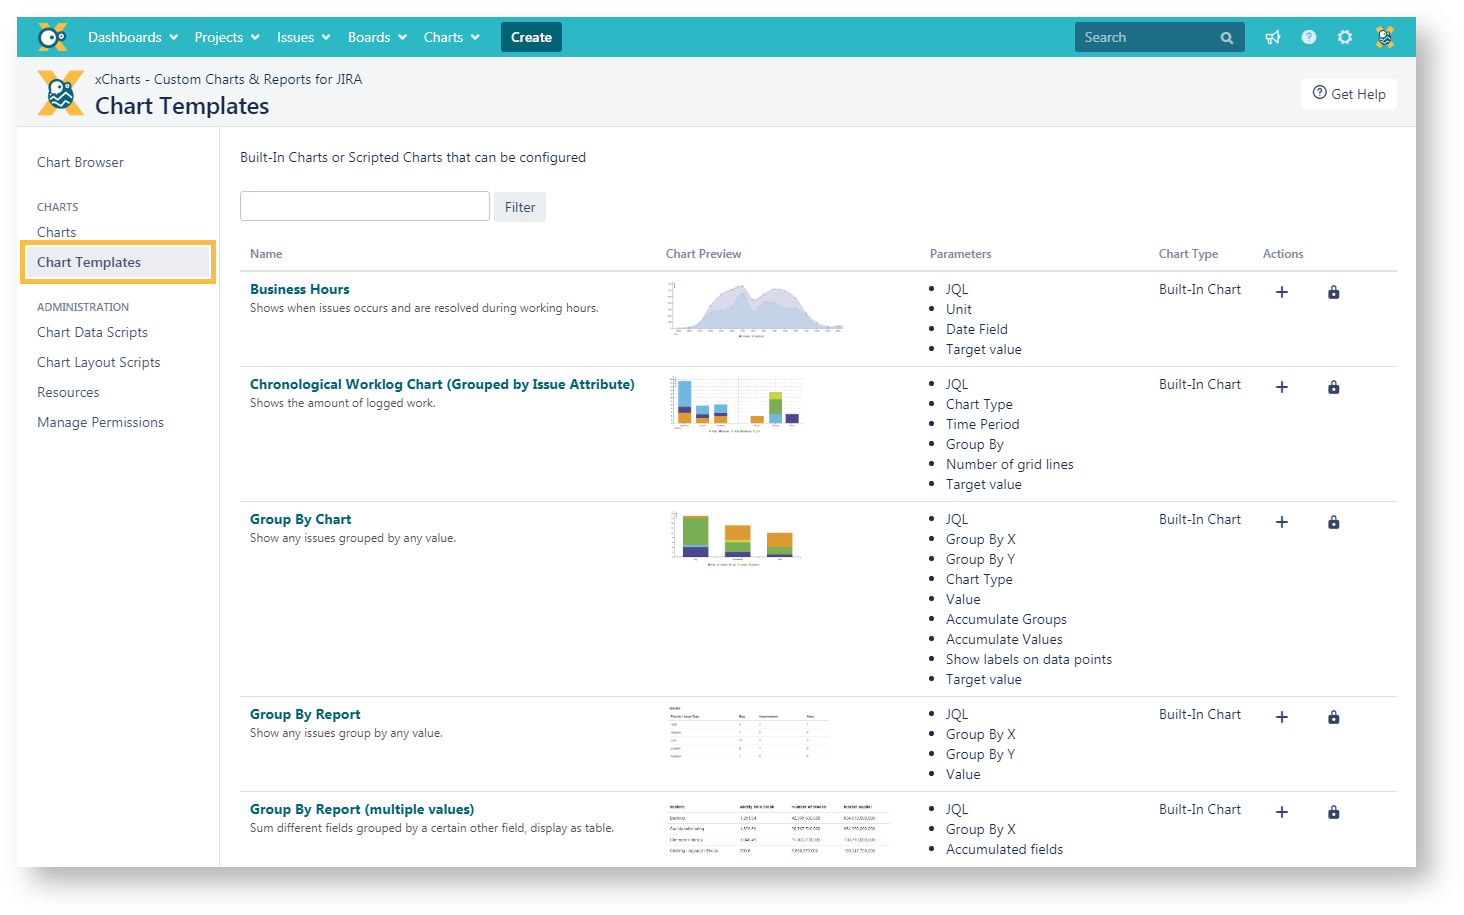
Name: Displays the name and a description of a template.
Parameters: Show all parameters, which can be defined for a chart
Chart Type: Shows whether a chart is a built-in or a scripted chart.
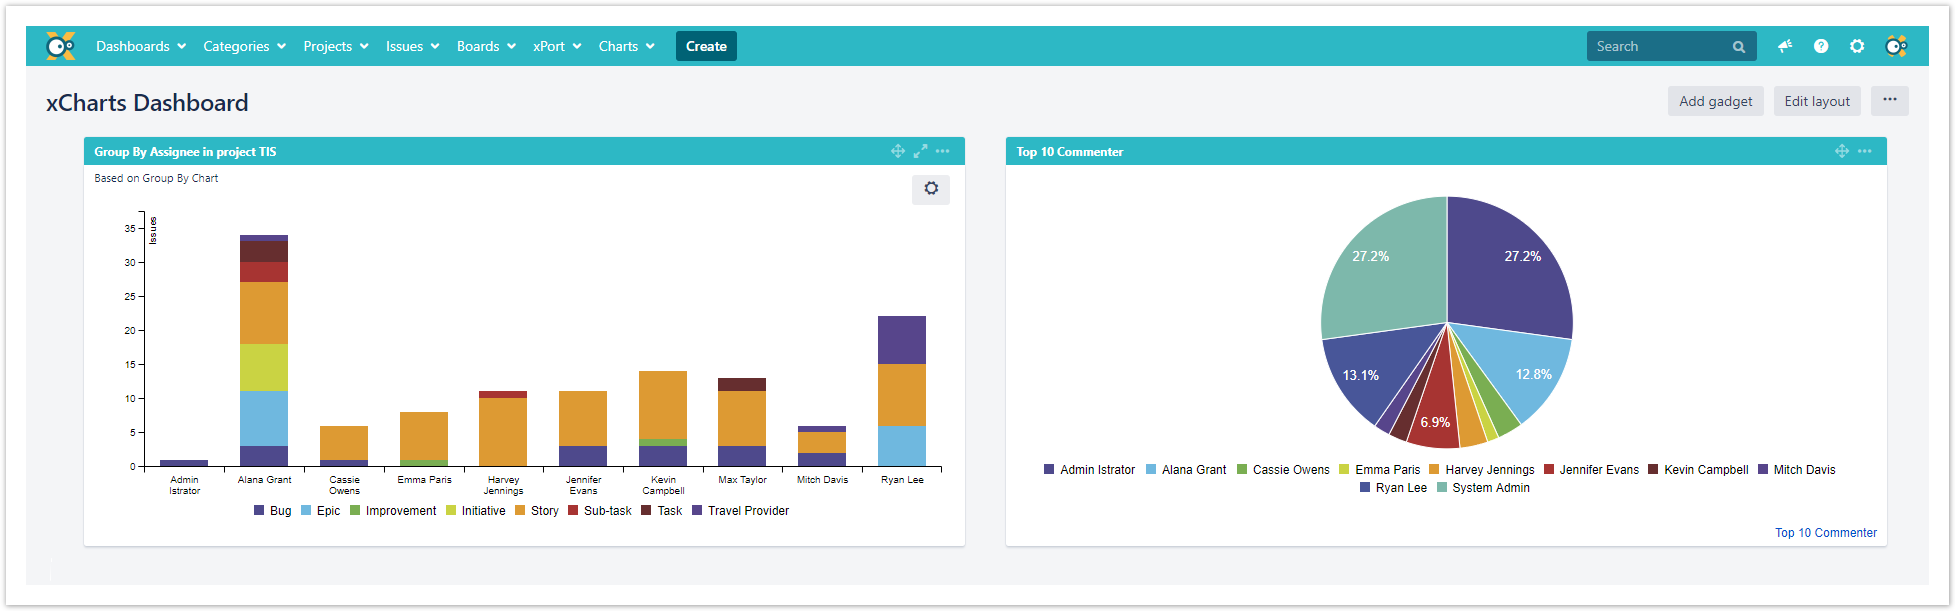
Currently there are two gadgets available within xCharts:
They can be used for displaying the created charts right on the dashboard.
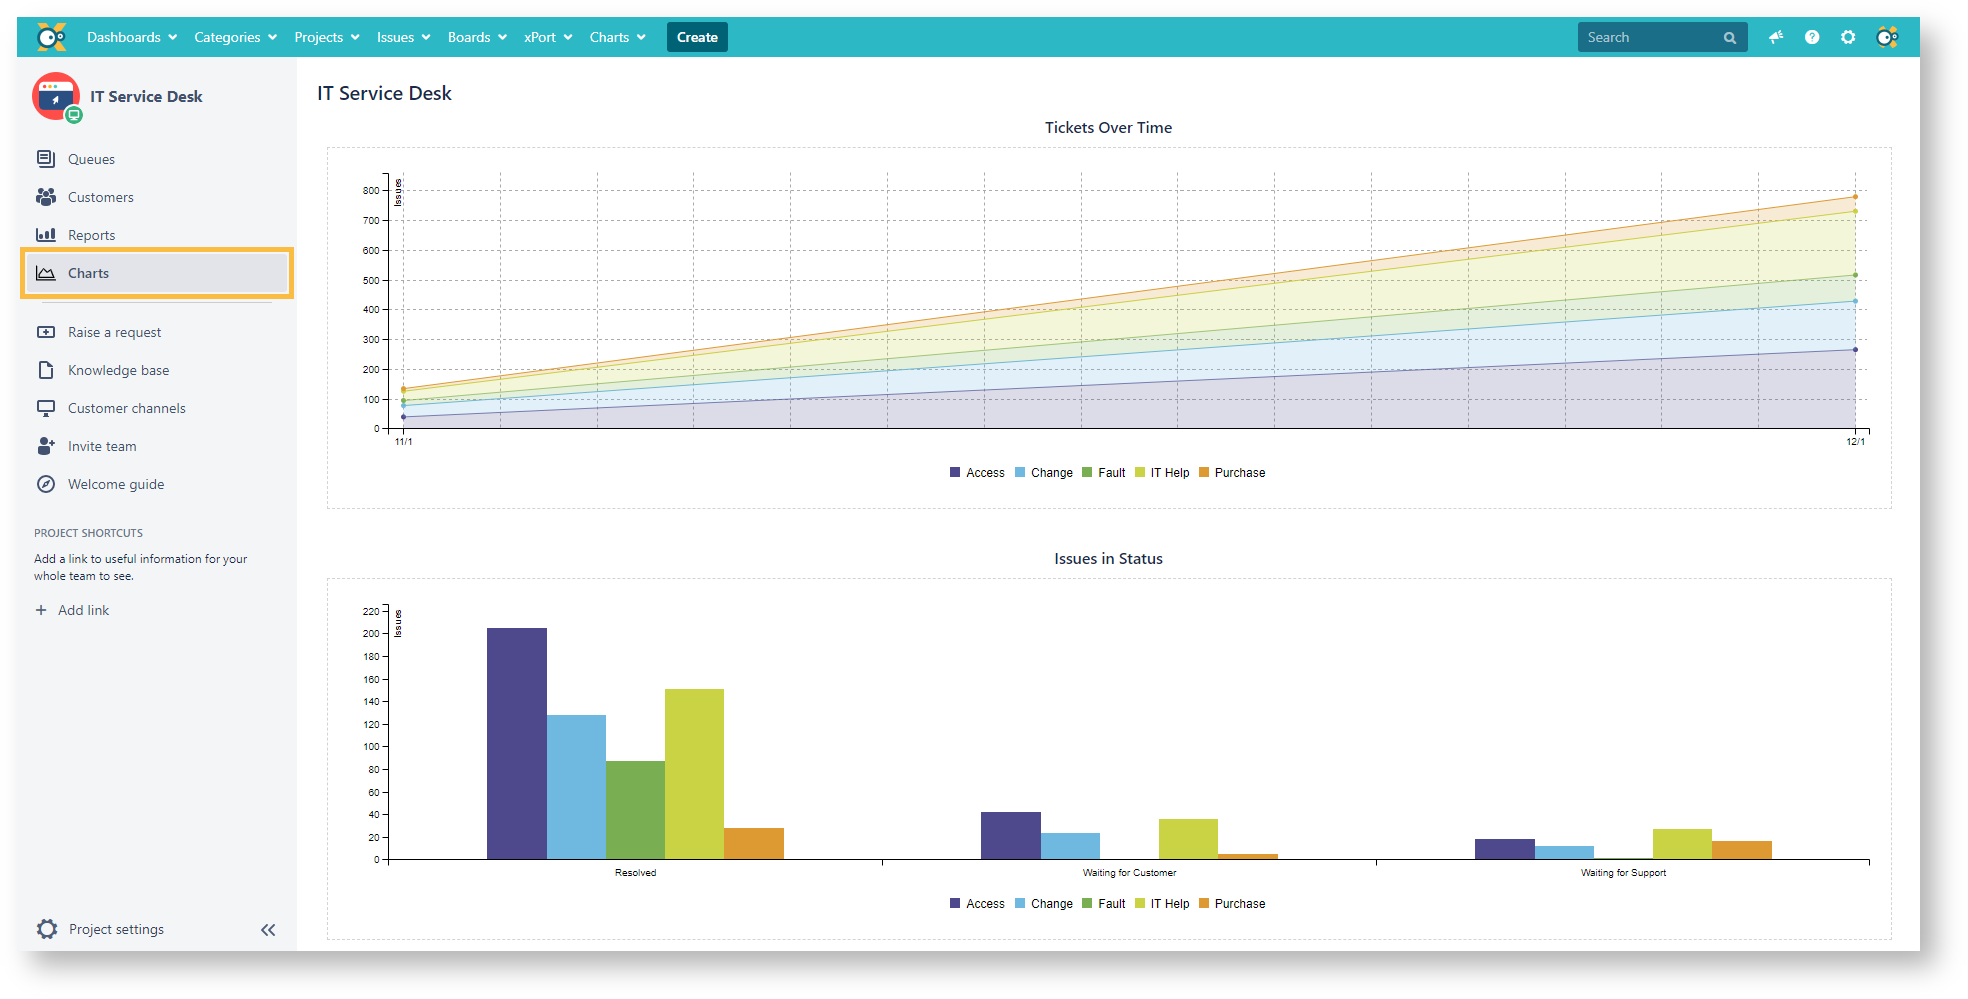
xCharts adds a "Charts" tab to the project navigation providing quick and easy access to relevant charts relevant for the project, e.g. Tickets over Time.
When marking a chart as favorite chart, it will be available in the drop-down menu on the "Chart browser" page and in the drop-down "Charts" menu in the Jira top navigation bar.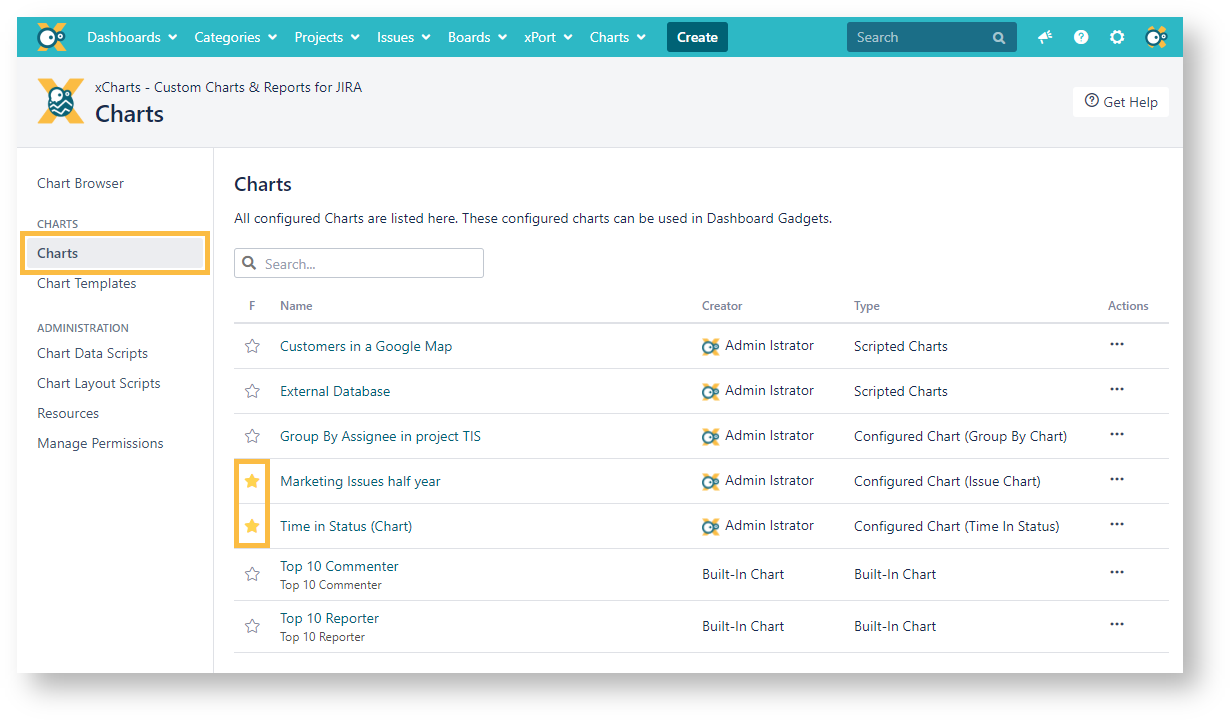
Glossary
Built-in chart: Chart that is bundled in the plugin (configurable or not)
Scripted chart: Chart created by users, written in Groovy Script.
Javascript layout: The JS function that generates the c3.js chart and displays it.
If you still have questions, feel free to refer to our support team.