On this page
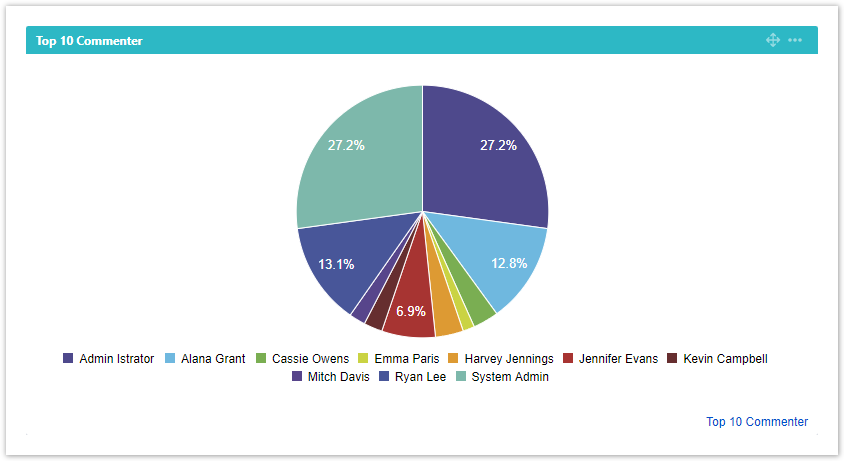
The xCharts gadget can be used for displaying created charts and reports directly on the dashboard.
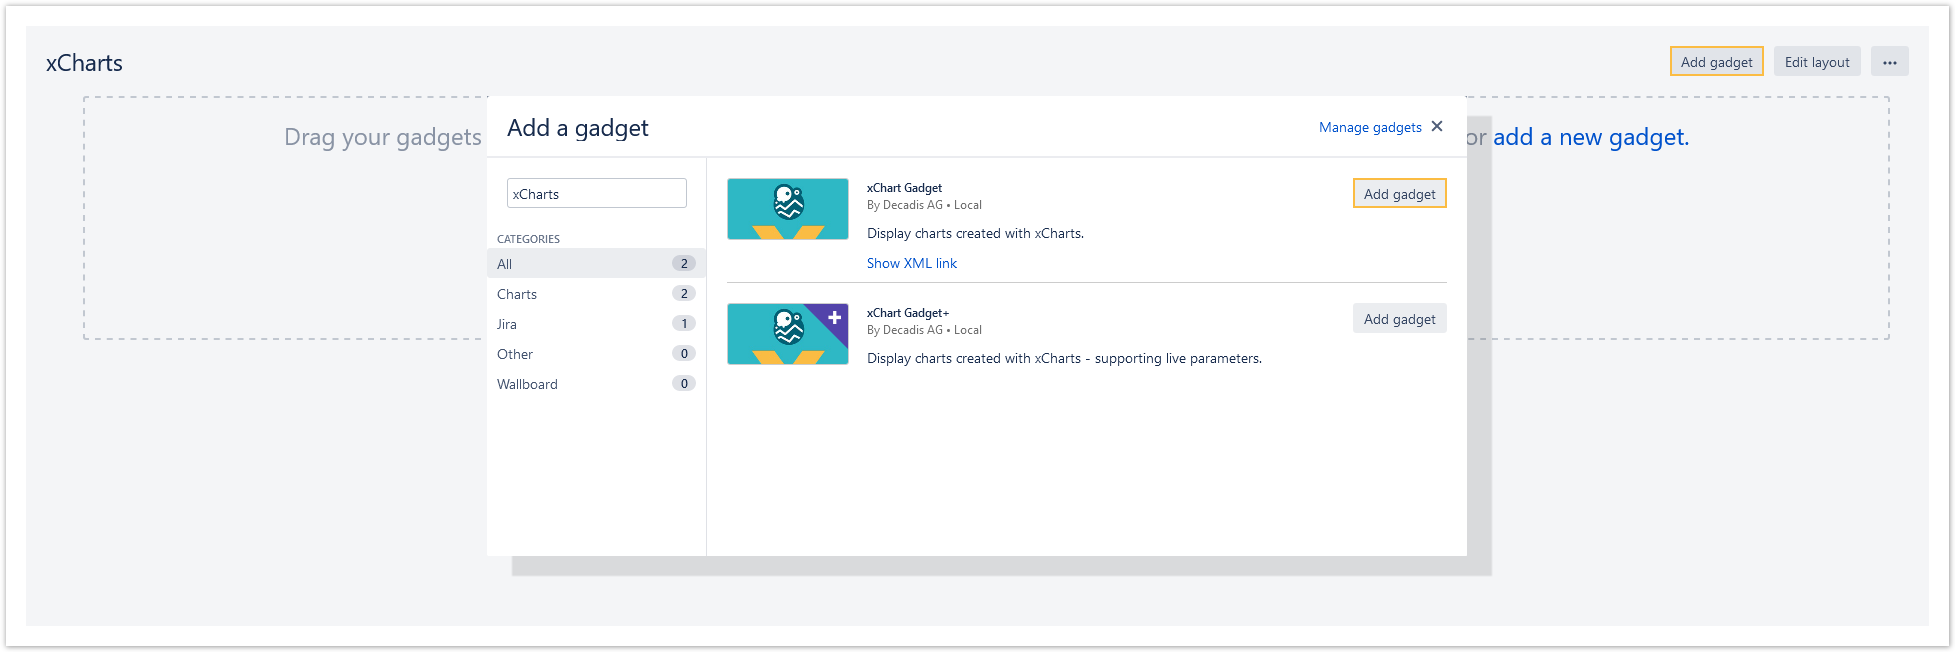
Adding the gadget to the dashboard
The gadget can be added by hitting the "Add gadget" button on the dashboard and searching for "xChart":
 Configuration
After adding the gadget to the dashboard it can be easily configured:

| Parameter | Description |
|---|---|
| Chart | Select the chart that you want to be displayed. |
| Background color | The background color of the gadget can be set by using the color's hex value or just typing the name, e.g., "white" or "red". |
| Chart settings | After the configuration is done, you can click on the "Change" button to edit the chart configuration again. |
| Refresh interval | Set how often the chart should be refreshed, the following are your options:
|
If you still have questions, feel free to refer to our support team.