Page History
| UI Text Box | ||||
|---|---|---|---|---|
| ||||
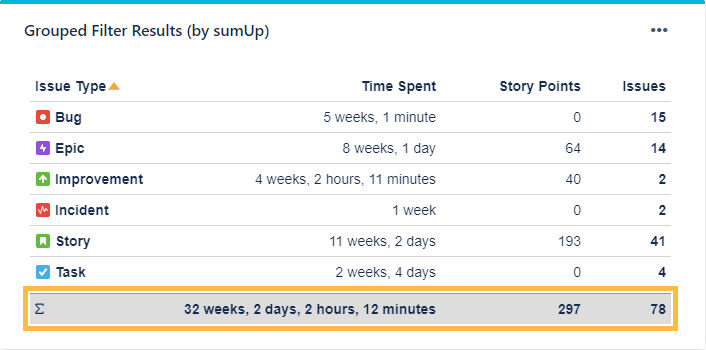
The Grouped Filter Results (by sumUp) gadget can be used to calculate calculates sums of multiple fields while the source issues are grouped by one custom field. |


 Configuration
| UI Expand | |||||||||||
|---|---|---|---|---|---|---|---|---|---|---|---|
| |||||||||||
Select an existing filter or choose to enter custom JQL. | |||||||||||
| |||||||||||
Select whether you want to use a predefined JQL Filter or a custom JQL to get the issues.
| |||||||||||
| UI Expand | |||||||||||
| |||||||||||
|
| UI Expand | |||||
|---|---|---|---|---|---|
| |||||
Add fields to be displayed as columns and reorder them using drag and drop.
 |
| UI Expand | ||||||||
|---|---|---|---|---|---|---|---|---|
| ||||||||
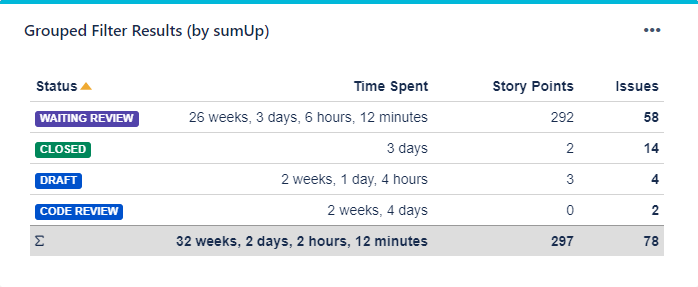
The main difference from our Filter Results (by sumUp) gadget is the grouping feature. With this feature, you can select the field by which to group (aggregate) the results. For example, you can group by End Date to see the quarterly costs. Additionally, when aggregating by date fields like End Date, you get more options to further refine the results. How to configure these settings can be seen in the Additional Options. Select a field that will be used to to group the results on the y-axisAxis. ExamplesExample:
Issue type | Status |
 |


| UI Expand | ||
|---|---|---|
| ||
Choose how many results you want to display on your dashboard. |
Additional options
| ui-expand-text-box | ||||
|---|---|---|---|---|
| ||||
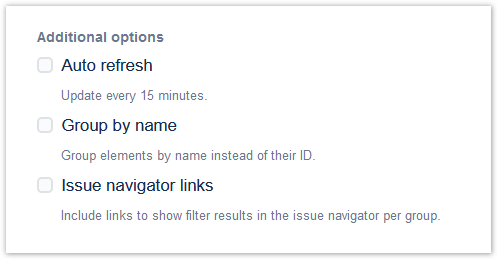
Configure your sumUp gadget with date-related settings such as the default time period and the default date aggregation level. Additional options include a 15-minute data refresh, grouping results by name, and adding links to the Issue Navigator. |
| UI Expand | |||||
|---|---|---|---|---|---|
| |||||
| |||||
| Excerpt | |||||
| Option | Description | ||||
Check this option to refresh the results of the gadget every 15 minutes.
|
| UI Expand | |||||
|---|---|---|---|---|---|
| |||||
This option is helpful if you wish to group the results by fields that share the same name or the options. For example, if you have a fix version named "EAP_Q2" across multiple projects, checking this option will ensure the results will be grouped under the same name instead of showing them as separate entries.
|
| UI Expand | ||||||||||||
|---|---|---|---|---|---|---|---|---|---|---|---|---|
| ||||||||||||
If you are someone who likes seeing the issues behind numeric entries on the gadget, this option is your match. With this option checked, you are taken to the Issue navigator page every time you click on a numeric entry on the sumUp gadget. Once you are on the Issue navigator page, you can see the JQL (and subsequently the issues) that accounts for the numeric entry displayed on gadget.
|
| UI Expand | ||
|---|---|---|
| ||
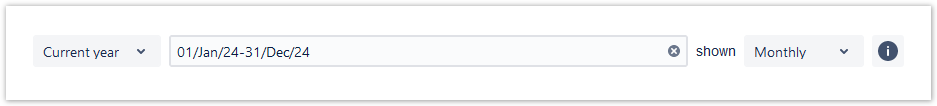
If you have chosen to group the data by a date or date time field (e.g. Due date or Created), you can set a default time period for the displayed data when the gadget is loaded or refreshed. You can choose between:
|
| UI Expand | ||
|---|---|---|
| ||
If you have chosen to group the data by a date or date time field (e.g. Due date or Created), you can set a default aggregation level for the displayed data when the gadget is loaded or refreshed. You can choose between:
|
 View mode
| UI Expand | |||||
|---|---|---|---|---|---|
| |||||
|
| UI Expand | ||||||||||||||||||||||||||||||||||
|---|---|---|---|---|---|---|---|---|---|---|---|---|---|---|---|---|---|---|---|---|---|---|---|---|---|---|---|---|---|---|---|---|---|---|
| ||||||||||||||||||||||||||||||||||
|

 Use cases and examples
| Page properties report | ||||||
|---|---|---|---|---|---|---|
|
| Excerpt Include | ||||||
|---|---|---|---|---|---|---|
|