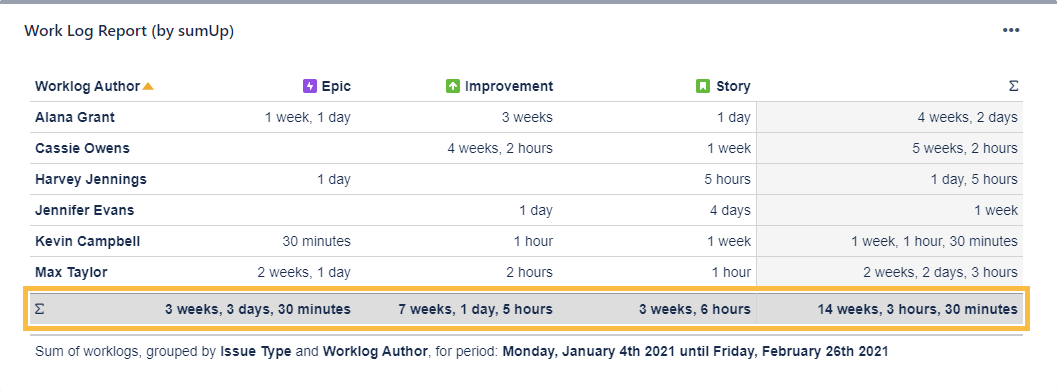
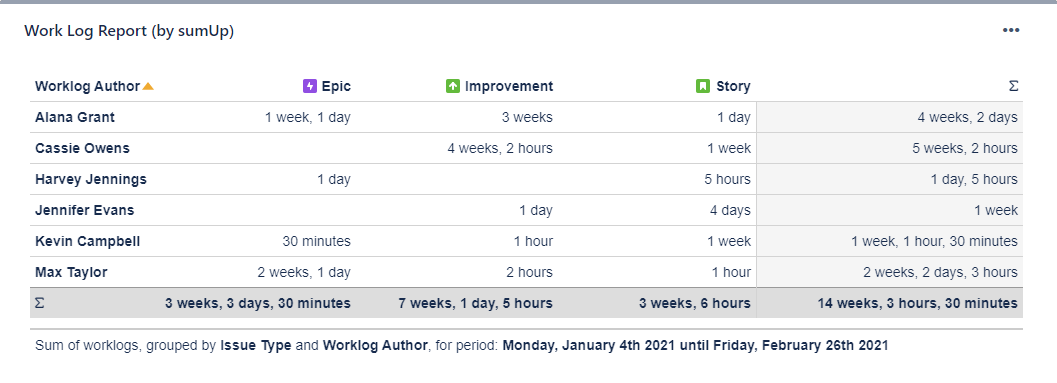
The Work Log Report (by sumUp) is similar to the Two Dimensional Filter Statistics gadget with the difference that it sums up work logs instead of numeric custom fields.


Configuration

Which issues do you want to analyze?

Select an existing filter or choose to enter custom JQL.

Only available if Custom JQL was selected in the Filter parameter.

What time period would you like to view?

Only time logs of the selected period will be displayed.

Available options are:

  • Current week
  • Last week
  • Last two weeks
  • Current month
  • Custom (define a custom period)


For custom periods only

From

Select the start date or enter a relative date (e.g. -3m for three months in the past).

To

Select the end date or enter a relative date (e.g. 1w for one week into the future).

Relative time frames

d = days, w = weeks, m = months, y = years)

How do you want to group the results?

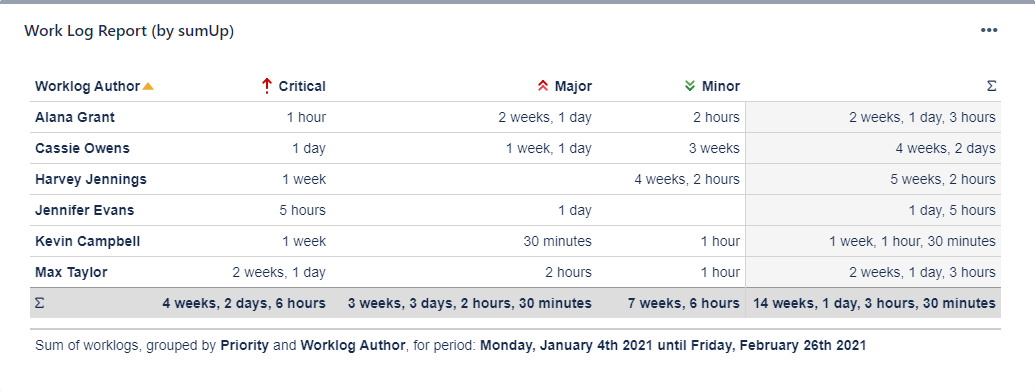
Select a field that will be used to group the results by on the X-axis.

Examples:

Work log author and issue typeWorklog author and priority


Choose the computation strategy

Define how sumUp will process the calculation internally. Choose one of these two options:

  1. Large number of work logs per returned issue
    • If you expect a large number of work logs per issue, this strategy should deliver the results faster.
  2. Large number of returned issues
    • If you expect a large number of issues with a relatively small number of work logs, choose this option - it will be faster.
How many rows do you want to display per page?

Choose how many results you want to display on your dashboard.

Choose additional options

Optionally, you can set different additional options to change the behavior of this gadget.

OptionDescription
Do you want to refresh your data every 15 minutes?

Check this option to refresh the results of the gadget every 15 minutes.

Enabling this option is useful when displaying information that needs a periodic refresh. For example, displaying the gadget on a wallboard.

Do you want to group the elements by name instead of their ID?

This option is helpful if you wish to group the results by fields that share the same name or the options. For example, if you have a fix version named "EAP_Q2" across multiple projects, checking this option will ensure the results will be grouped under the same name instead of showing them as separate entries.

  • By default, all values will be grouped by their ID, meaning that fields or options that share a common name will be treated as two different values, since they don't have the same ID in the database.
    When checking the checkbox , options with the same option name will be treated as one option , even though they are saved as different values in the database.

  • This option is not available for all the fields. It is only available on selecting the certain fields in "Group by" section that could share same name or options. Some of the fields where this option is applicable are:
    • Versions
    • Components
    • Issue type
    • Severity
    • Sprint
    • Status
    • Option-based fields
Do you want to include links to show results in the issue navigator?

If you are someone who likes seeing the issues behind numeric entries on the gadget, this option is your match. With this option checked, you are taken to the Issue navigator page every time you click on a numeric entry on the sumUp gadget. Once you are on the Issue navigator page, you can see the JQL (and subsequently the issues) that accounts for the numeric entry displayed on gadget.


In case of text fields, it is not possible to perform an exact search due to limitations of Jira Cloud JQL, so it may happen that more issues are shown than expected. If the text field contains special characters ( ((" ") + . , ; ? !| * / % ^ $ # @ [ ]) <>), they will be ignored in the JQL search.

If you do not usually go to the Issue navigator or if the loading time for your gadget is too high, leave the option unchecked.

Which time period do you want to display as default?

If you have chosen to group the data by a date or date time field (e.g. Due date or Created), you can set a default time period for the displayed data when the gadget is loaded or refreshed.

You can choose between: 

  • Current week
  • Current month
  • Current quarter
  • Current year
  • All-time
Which default date aggregation level do you choose?

If you have chosen to group the data by a date or date time field (e.g. Due date or Created), you can set a default aggregation level for the displayed data when the gadget is loaded or refreshed.

You can choose between: 

  • Daily
  • Weekly
  • Monthly
  • Quarterly
  • Yearly

Rendering this gadget can be resource-intensive if there is a large number of work logs.


If you still have questions, feel free to refer to our support team.