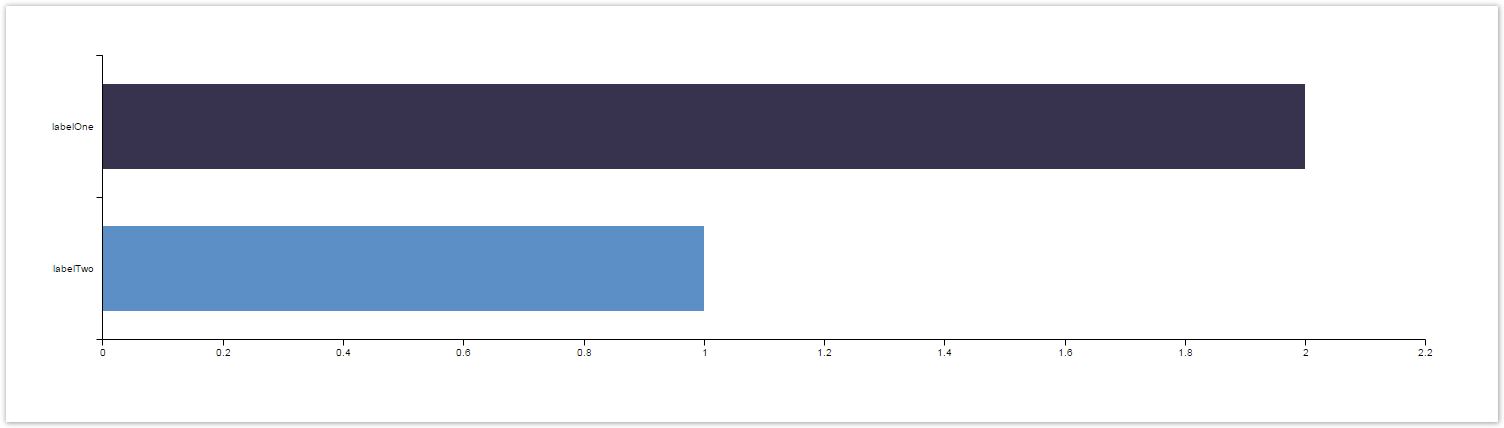
This example illustrates a simple use case: connect to an external database and show a simple bar chart. In this example, we are using the Jira database, but you can use any database.

  • Goal: Collect all Labels in Jira and count the associated issues
  • Prerequisite: MySQL JDBC Driver

approve Download Scripted Chart Bundle

Chart preview

Layout Script
c3.js Example
// disable the c3 legend
chartData.legend =  { show: false };
  
// change the default color behavior to add a color for each label
chartData.data.color = function(color, d){
    if(d.index != undefined) {
      return chartData.colors[d.index];
	}
  return color;
}
// let c3 do the rest
c3.generate(chartData)
 
// chartData - this variable contains the aggregated data for display and is generated by the script
Data Script
import java.sql.*;
import java.util.*;
import java.util.Map;
import java.util.Map.Entry;
import groovy.sql.Sql
import java.math.BigDecimal;
import com.atlassian.jira.util.json.JSONArray;
import com.atlassian.jira.util.json.JSONObject;
import com.atlassian.jira.component.ComponentAccessor;
import com.decadis.jira.xchart.utils.PastellColorUtil;
  
// JDBC Driver - here MySQL
String driverName = "com.mysql.jdbc.Driver";
Driver driver = Class.forName(driverName).newInstance() as Driver
  
// JDBC URL
String url = "jdbc:mysql://localhost/jira?useUnicode=yes&characterEncoding=UTF-8";
  
// SQL Authentication
Properties props = new Properties();
props.setProperty("user", "user");
props.setProperty("password", "password");
  
Connection c = driver.connect(url,props);
Sql sql = new Sql(c);
  
// SQL Statement
def sqlString = """ select * from label """;
  
Map map = new TreeMap<String,BigDecimal>();
  
// Iterate over each row, select rows by it.{rowName}
sql.eachRow(sqlString)
{
    
  // handle the data input
  if(map.get(it.label))
  {
    map.put(it.label,map.get(it.label).add(BigDecimal.ONE))
  }
  else
  {
    map.put(it.label,BigDecimal.ONE)
  }
}
  
c.close();
  
// create the c3 data
JSONObject chartData = new JSONObject();
JSONObject data = new JSONObject();
JSONArray colors = new JSONArray();
JSONArray columns = new JSONArray();
JSONArray column = new JSONArray();
JSONArray categories = new JSONArray();
// first colum entry must be the name of the data row - here labels
column.put(ComponentAccessor.getJiraAuthenticationContext().getI18nHelper().getText("admin.customfield.type.labels.name"));
int i = 0;
  
// add the collected values to the json array
for ( Entry<String,BigDecimal> entry : map.entrySet() )
{
  // add the value
  column.put(entry.getValue().intValue());
  //add the key
  categories.put(entry.getKey());
  // add a custom color
  colors.put(PastellColorUtil.toHex(PastellColorUtil.getNiceColor(i++ * 0.23)));
}
  
// combine the json objects
columns.put(column);
data.put("columns", columns);
data.put("type", "bar");
JSONObject axis = new JSONObject();
JSONObject x = new JSONObject();
x.put("type", "category");
x.put("categories", categories);
axis.put("x", x);
axis.put("rotated", "true");
chartData.put("data", data);
chartData.put("axis", axis);
chartData.put("colors",colors);
  
// return the jsonobject as string
return chartData.toString()
Example of resulting JSON object (chartData)
{
  "data": {
    "columns": [
      [
        "Stichwörter",
        2,
        1
      ]
    ],
    "type": "bar"
  },
  "axis": {
    "x": {
      "type": "category",
      "categories": [
        "labelOne",
        "labelTwo"
      ]
    },
    "rotated": "true"
  },
  "colors": [
    "#37334e",
    "#5b8fc6"
  ],
  "legend": {
    "show": false
  }
}


If you still have questions, feel free to refer to our support team.