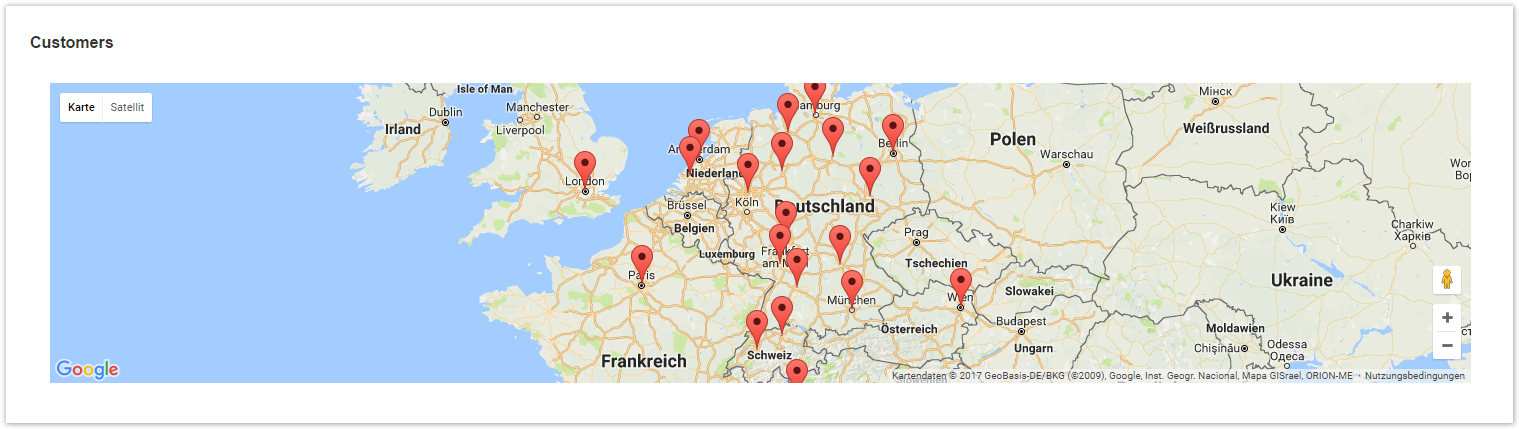
This example creates a Google Map, which shows flags based on a custom field.

approve Download Scripted Chart Bundle

Chart preview

Layout Script
document.getElementById('chart').innerHTML = "<div id='map' style='height:300px;width:100%'></div>";            //* Define your chart size
$.getScript("https://maps.googleapis.com/maps/api/js?key=ENTER-YOUR-API-KEY-HERE&signed_in=true", function(){   //* Enter your Google API Key here
   
    function initMap() {
      var map = new google.maps.Map(document.getElementById('map'), {
        zoom: 5,
        center: {lat: 50.357538, lng: 7.595110}             //* Choose your position
      });
 
    chartData["columns"].forEach(function(entry) { 
      if (entry[1] != 1)
      {
        $.get("https://maps.googleapis.com/maps/api/geocode/json?address="+entry[1]+"&key=ENTER-YOUR-API-KEY-HERE", function(data, status){  //* Enter your Google API Key here
 
          
            var marker = new google.maps.Marker({
              position: data.results[0].geometry.location,
              map: map,
              title: entry[0].replace('-x', '')
            });
         });
      }
    });
    }
    initMap();
    updateFrameHeight();
});
Data Script
import java.math.BigDecimal;
import java.text.DateFormat;
import java.util.Calendar;
  
import com.atlassian.jira.component.ComponentAccessor;
import com.atlassian.jira.issue.Issue;
import com.atlassian.jira.jql.parser.JqlParseException;
import com.atlassian.jira.jql.parser.JqlQueryParser;
import com.atlassian.query.Query;
import com.decadis.jira.xchart.api.model.Period;
import com.decadis.jira.xchart.api.util.DateUtils;
  
def metaCountGroup =  chartBuilder.newDataCollector()
def cfCustomerAddress = ComponentAccessor.getCustomFieldManager().getCustomFieldObject(/*ENTER YOUR CUSTOM-FIELD ID HERE */);
  
JqlQueryParser jqlQueryParser = ComponentAccessor.getComponent(JqlQueryParser.class);
Query query = null;
  
try
{
  query = jqlQueryParser.parseQuery("/*ENTER YOUR JQL HERE */");
} catch (JqlParseException e)
{
  throw new IllegalArgumentException("Bad JQL: " + query);
}
  
for ( Issue issue : chartBuilder.getFilterUtils().performSearchOverrideSecurity(query) )
{
    if(cfCustomerAddress.getValue(issue) != null)
    {
        metaCountGroup.addValue(BigDecimal.ONE, issue.getSummary(), cfCustomerAddress.getValue(issue));
    }
}
  
def chartData = chartBuilder.newChartData("Customers");
  
chartBuilder.getChartUtil().transformResult(metaCountGroup, chartData);
return chartData;


If you still have questions, feel free to refer to our support team.