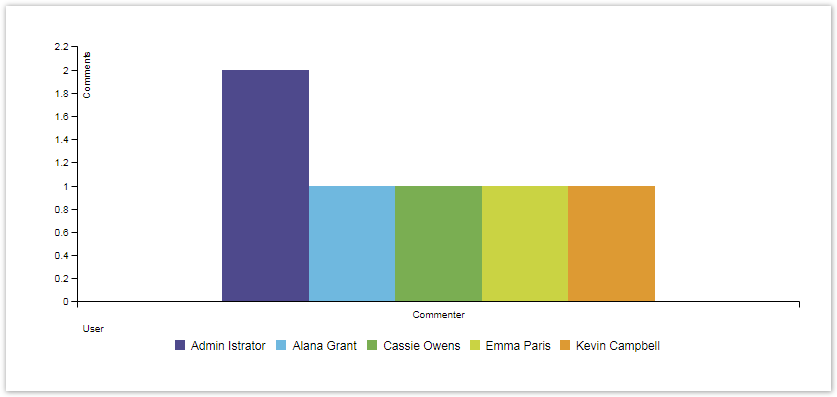
This chart counts the number of comments for every user that commented on an issue based on a JQL result.

approve Download Scripted Chart Bundle

Chart preview

Layout Script
Easy Group By
function formatTooltipAsHours(value, ratio, id, index)
{
    return value.toFixed(2) + ' h';
}
 
function formatTooltipAsHoursWithDays(value, ratio, id, index)
{
    var hours = parseInt(value);
    var days = parseInt(hours / 24);
    value = value - days * 24;
    if (days > 0)
    {
        return days + 'd, ' + value.toFixed(2) + ' h';
    }
    return value.toFixed(2) + ' h';
}
 
var c3arg = {
    onrendered: updateFrameHeight,
    data: chartData,
    axis: {
        x: {
            type: 'category', // this is needed to load string x value
            label: {
                text: chartData.custom.xLabel,
                position: 'outer-left'
            }
        },
        y: {
            label: chartData.ytype
        }
    }
};
 
if (chartData.custom && chartData.custom.tooltip)
{
    var tooltipFunction = eval(chartData.custom.tooltip);
    c3arg.tooltip = {
        format: {
            value: tooltipFunction
        }
    };
}
 
c3.generate(c3arg);

Chart Script

This chart has two parameters:

  1. JQL: all issues returned by the JQL search will be evaluated
  2. ChartTypePicker: simple picker to select the chart layout

The script can be copied and pasted into the chart data script part

Chart Script
import java.math.BigDecimal;
import java.text.DateFormat;
import java.util.Calendar;
 
import com.atlassian.jira.component.ComponentAccessor;
import com.atlassian.jira.issue.Issue;
import com.atlassian.jira.jql.parser.JqlParseException;
import com.atlassian.jira.jql.parser.JqlQueryParser;
import com.atlassian.query.Query;
import com.decadis.jira.xchart.api.model.Period;
import com.decadis.jira.xchart.api.util.DateUtils;
import com.decadis.jira.xchart.api.model.ChartData;
import com.atlassian.jira.issue.comments.Comment;
import com.atlassian.jira.issue.comments.CommentManager;
import com.decadis.jira.xchart.api.ForeachDocumentIssue;
import org.apache.lucene.document.Document;
 
def countGroup = chartBuilder.newDataCollector();
 
JqlQueryParser jqlQueryParser = ComponentAccessor.getComponent(JqlQueryParser.class);
Query query = null;
 
try
{
    query = jqlQueryParser.parseQuery(JQL); //JQL is a parameter of type Jql Autocomplete Picker
} catch (JqlParseException e)
{
    throw new IllegalArgumentException("Bad JQL: " + query);
}
  
CommentManager commentManager = ComponentAccessor.getCommentManager();
 
ForeachDocumentIssue searchClosure = {Issue issue, Document doc ->
 
  List<Comment> comments = commentManager.getCommentsForUser(issue, user);
  for ( Comment comment : comments )
  {
    countGroup.addValue(BigDecimal.ONE, comment.getAuthorFullName(), comment.getAuthorFullName());
  }
}
 
chartBuilder.getFilterUtils().blockSearch(searchClosure, query, user);
 
ChartData chartData = chartBuilder.newChartData("Comments");
chartData.setType(ChartTypePicker);
  
chartBuilder.getChartUtil().transformResult(countGroup, chartData, false);
  
return chartData;


If you still have questions, feel free to refer to our support team.