By using xCharts it is either possible to use a whole bunch of built-in charts and reports or just create complete new customized charts. These charts always consist of a Chart Data Script and a Chart Layout Script.
For further customization, it is also possible to add your own resources, like js- or CSS-files. This way they can be easily reused in several charts.
Creating a self scripted chart
A new self scripted chart can be created by going to the xCharts administrations: 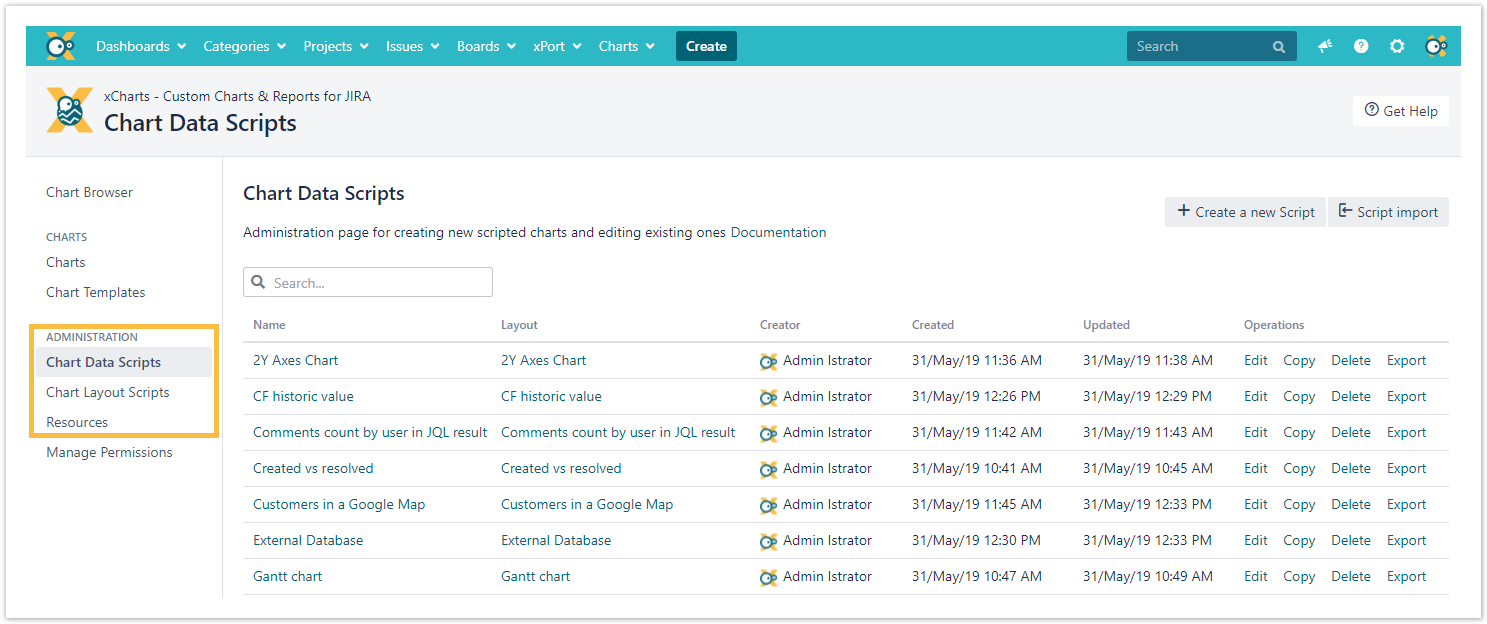
 Chart scripting examples
If you still have questions, feel free to refer to our support team.