Chart preview
Parameters
Name | Type |
---|---|
JQL | JQL autocomplete |
Related examples
If you still have questions, feel free to refer to our support team.
You are viewing an old version of this page. View the current version.
Compare with Current View Page History
« Previous Version 5 Current »
This example illustrates a simple use case: showing the number of certain issue types over a time period.
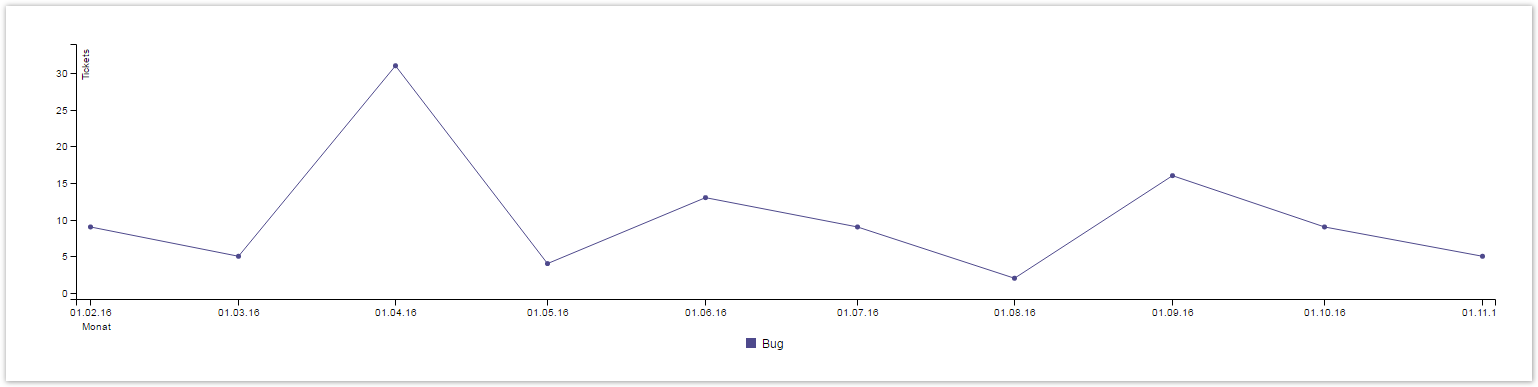
The resulting chart, when having a JQL Parameter that selects only Bug issue types, is the following:
Name | Type |
---|---|
JQL | JQL autocomplete |
used layout: Default Timeseries.
c3.generate({ data: chartData, axis: { x: { type: 'timeseries', label: { text: 'Months', position: 'outer-left' }, tick: { format: '%d.%m.%y', culling: { max: 25 }, fit: true, multiline: false } }, y: { label: 'Tickets' } } }) // chartData - this variable contains the aggregated data for display and is generated by the script
import java.math.BigDecimal; import java.text.DateFormat; import java.util.Calendar; import com.atlassian.jira.component.ComponentAccessor; import com.atlassian.jira.issue.Issue; import com.atlassian.jira.jql.parser.JqlParseException; import com.atlassian.jira.jql.parser.JqlQueryParser; import com.atlassian.query.Query; import com.decadis.jira.xchart.api.model.Period; import com.decadis.jira.xchart.api.util.DateUtils; import com.decadis.jira.xchart.api.model.ChartData; def metaCountGroup = chartBuilder.newDataCollector(); DateFormat dateFormat = DateUtils.SimpleDateFormat; JqlQueryParser jqlQueryParser = ComponentAccessor.getComponent(JqlQueryParser.class); Query query = null; try { query = jqlQueryParser.parseQuery(JQL); //JQL is a parameter of type Jql Autocomplete Picker } catch (JqlParseException e) { throw new IllegalArgumentException("Bad JQL: " + query); } Period selectedPeriod = Period.MONTH; for ( Issue issue : chartBuilder.getFilterUtils().performSearchOverrideSecurity(query) ) { Calendar cwCreated = dateUtils.getStartOfPeriod(issue.getCreated(), selectedPeriod); String cw = dateFormat.format(cwCreated.getTime()); metaCountGroup.addValue(BigDecimal.ONE, issue.getIssueType().getName(), cw); } ChartData chartData = chartBuilder.newChartData("Issues"); chartData.setxFormat("%Y.%m.%d"); chartData.setType("line"); chartBuilder.getChartUtil().transformResult(metaCountGroup, chartData, false); return chartData;
{ "colors": { "Bug": "#4e498c" }, "xs": { "Bug": "Bug-x" }, "empty": { "label": { "text": "No data." } }, "custom": { }, "columns": [ [ "Bug", 9, 5, 31, 4, 13, 9, 2, 16, 9, 5 ], [ "Bug-x","2016.02.01","2016.03.01","2016.04.01","2016.05.01", "2016.06.01","2016.07.01","2016.08.01","2016.09.01","2016.10.01","2016.11.01" ] ], "groups": [ [ "Bug" ] ], "hide": [ ], "type": "line", "xFormat": "%Y.%m.%d", "order": null, "labels": null, "ytype": "Issues", "xtype": null }
If you still have questions, feel free to refer to our support team.
Powered by Atlassian Confluence 8.5.7, themed by Refined 7.5.3 and Decadis AG